GUI (Watchfire.app)
A guided tour of Watchfire.app, the Electron multi-project client for managing tasks, monitoring agents, and reviewing work.
The GUI is a multi-project client built with Electron. Unlike the CLI/TUI (which is project-scoped), the GUI shows every registered project in one place and connects to the daemon over gRPC-Web.
Looking for a single-page reference? The Keyboard Shortcuts cheat sheet lists every GUI binding in printable form.
Layout
The window splits into three regions:
- Sidebar — the flame mark, project list, "Add Project," and the Settings entry. Always visible.
- Main content — either the Dashboard or the active Project View, with the integrated terminal docked as a footer (toggle with Cmd+`).
- Right panel — Chat, Branches, and Logs. Collapsible — pop it out when you want to focus on the main area.
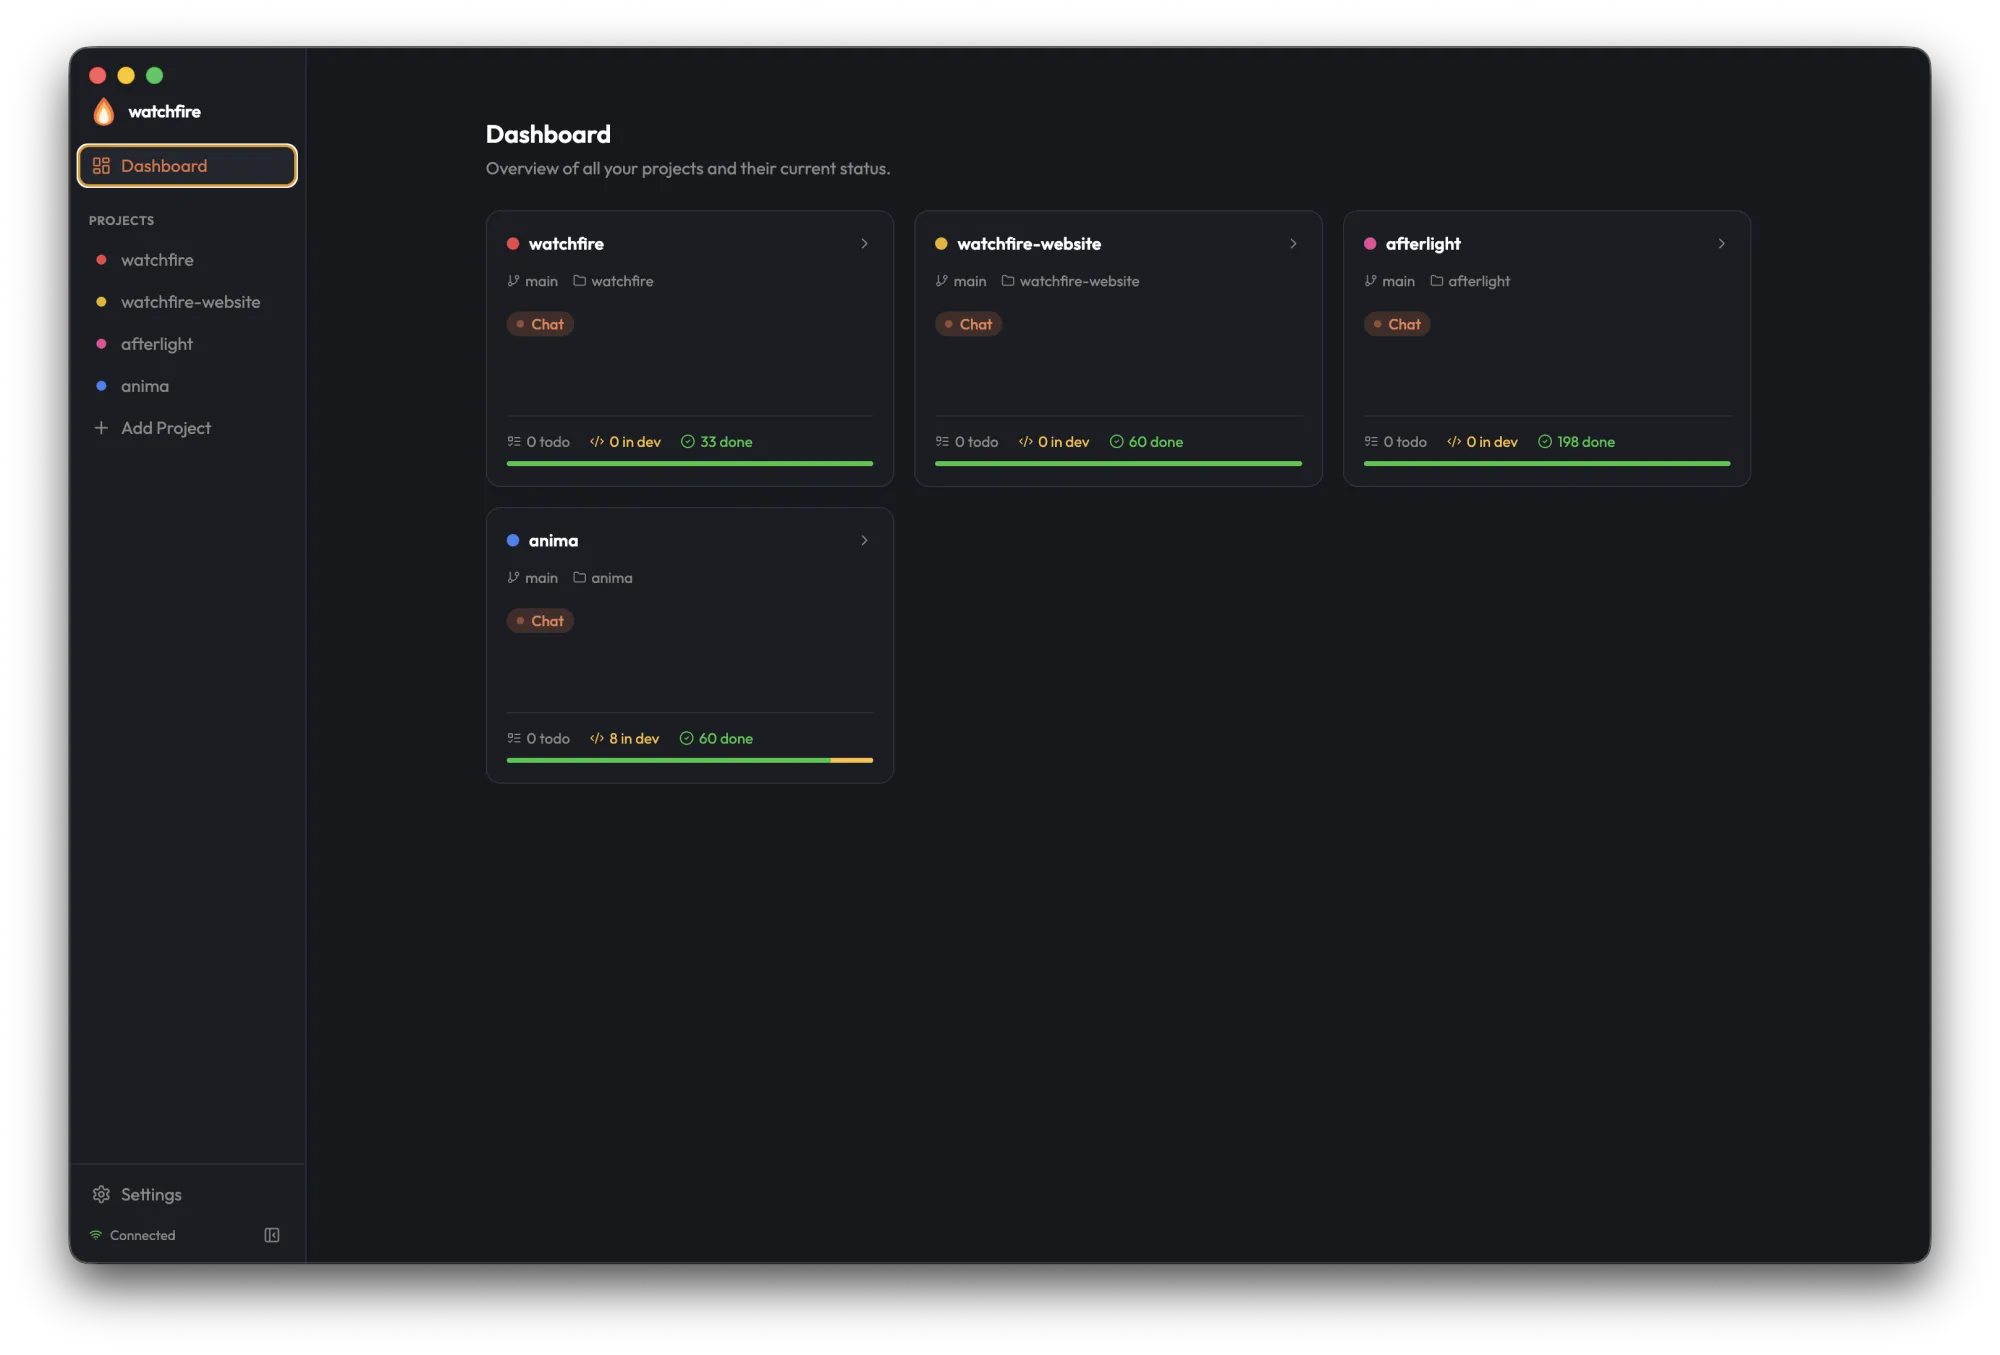
Dashboard
The dashboard is the home view: every registered project rendered as a card with its color dot, current branch, default agent, and a Todo / In Dev / Done task summary with a progress bar. Click any card to drop into the Project View.
Status bar & filters
A single muted line — N working · N needs attention · N idle · N done today — sits between the dashboard header and the project grid as a fleet-wide pulse check.
Below it, a row of pill chips narrows the grid to one bucket at a time. Each chip carries a live count, and the selection persists across reloads via localStorage[wf-dashboard-filter].
| Chip | Selects |
|---|---|
All | Every registered project |
Working | Projects with an agent currently running |
Needs attention | Projects with a task in done + success: false |
Idle | Projects with no running agent and nothing ready |
Has ready tasks | Projects with at least one ready task waiting for an agent |
The Beacon Insights rollup card (cross-project KPIs, top projects, and a global <ExportPill>) sits under the status bar and shares the 7d / 30d / 90d / All window selector with the Project View. See the Insights concept page for what's aggregated and how the tasks_missing_cost caveat surfaces partial data.
Sort & layout
Cards are auto-bucketed by activity rather than raw position: needs-attention → working → has-ready-tasks → idle. When the activity order diverges from the stored position order, a muted Sorted by activity label surfaces in the header so a manual reorder is still visible.
A LayoutGrid / Rows3 toggle in the header switches between the default card grid and a compact list view (one ~46px row per project). The choice persists across reloads via localStorage[wf-dashboard-layout].
Project cards
Each card carries:
- Project name, color dot, current branch, and the active-agent badge
- Elapsed-time badge — when the agent is running, a ticking
Ns / Nm / Nh Mmcounter sits next to the agent badge and flips to a warning color once it crosses 30 minutes - Last-activity timestamp —
Active now / 5m ago / 4h ago / 2mo agosegment, derived from the most recent taskupdated_at - Live PTY preview — the latest non-blank terminal line, in monospace muted text, throttled to 4 Hz. A singleton subscription manager ref-counts the underlying
AgentService.SubscribeScreenstream, so the dashboard opens at most one stream per project regardless of how many cards reference it. - Current-task line — replaces the previous
Next:line withWorking: <current task title>(with aFlameicon) whenever the agent is actively running - Shell-count chip — terminal icon + count of alive shell sessions; pulses when any session emitted output in the last 2 seconds, and clicking it expands the integrated terminal bottom panel
- Task counts (Todo / In Dev / Done) and a progress bar
When a project has any task with status === 'done' && success === false, the card flips into a needs-attention treatment: a red-tinted border, an AlertTriangle chip in the header, an N failed segment in the counts row, and a red segment in the progress bar.
"Add Project" sits at the end of the grid as the entry point for the project wizard.
Add Project Wizard
A three-step wizard for adding new projects:
Step 1 — Project Info
- Project name
- Path (folder picker)
- Git status (auto-detected)
- Branch (auto-detected)
Step 2 — Git Configuration
- Target branch
- Auto-merge on completion
- Delete branch after merge
- Auto-start tasks
- Coding agent — picker populated from the daemon's
SettingsService.ListAgentsRPC (Claude Code, Codex, opencode, Gemini, Copilot, Cursor, plus any future backends). Seedsproject.default_agent.
Step 3 — Project Definition
- Markdown editor for project context
- Skip option for later
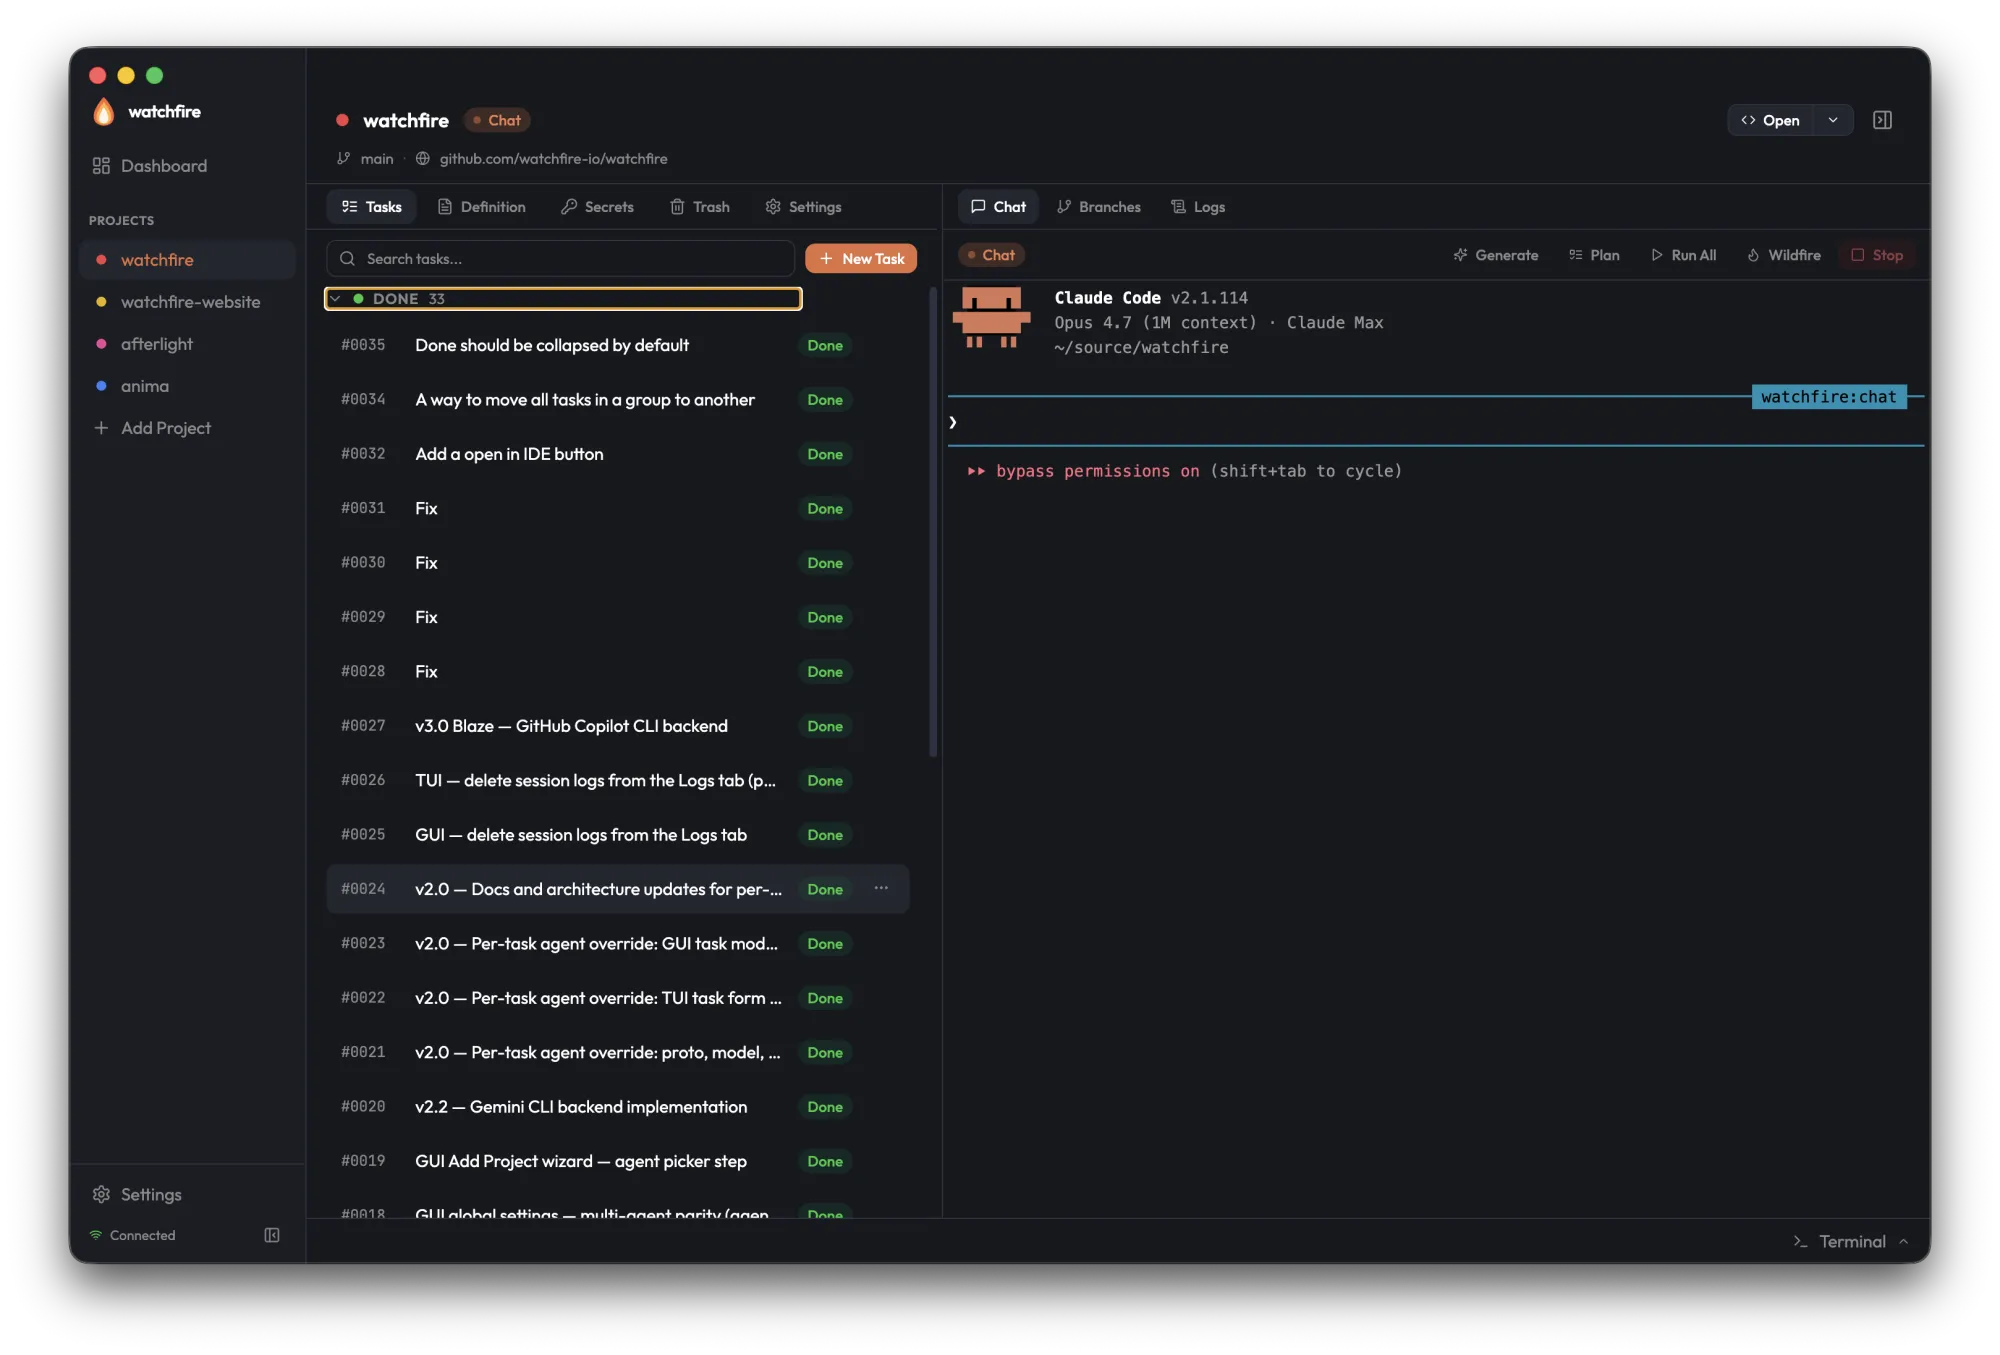
Project View
Selecting a project opens the split layout: a tabbed main area for managing the project, and a collapsible right panel for live agent output and history.
Main Tabs
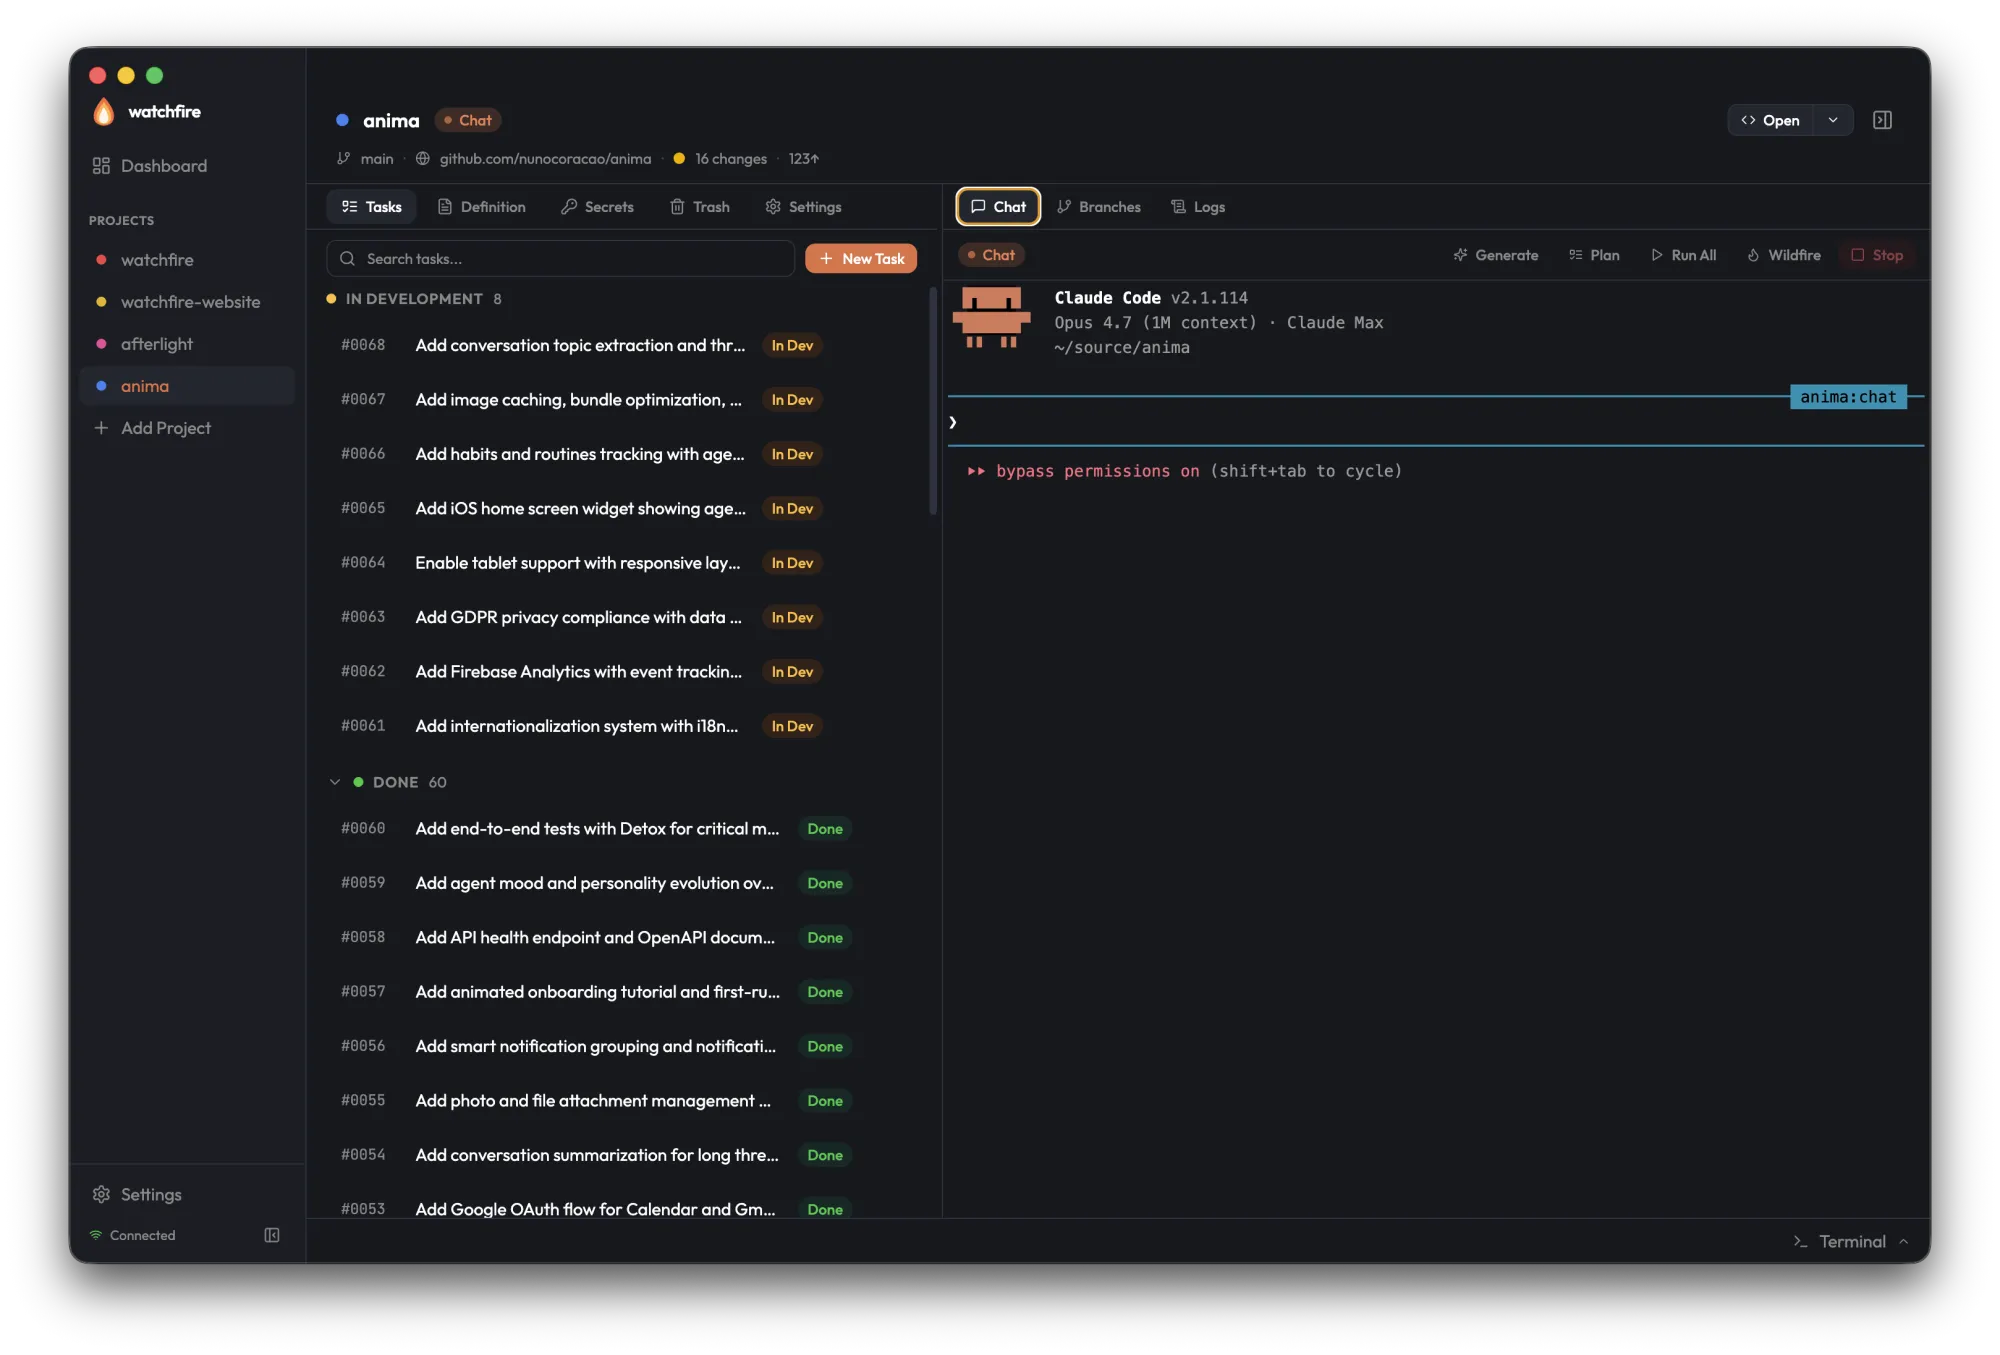
Tasks
Tasks are grouped by status (Draft, Ready, Done) with search, filters, and a "New Task" button. Each row shows a compact agent badge when its agent field overrides the project default. Active rows ("In Development" / "Todo") carry a GripVertical handle on the left for drag-to-reorder; the row body itself stays click-to-open so a single click still launches the edit modal. The "Failed" and "Done" groups render non-sortable rows.
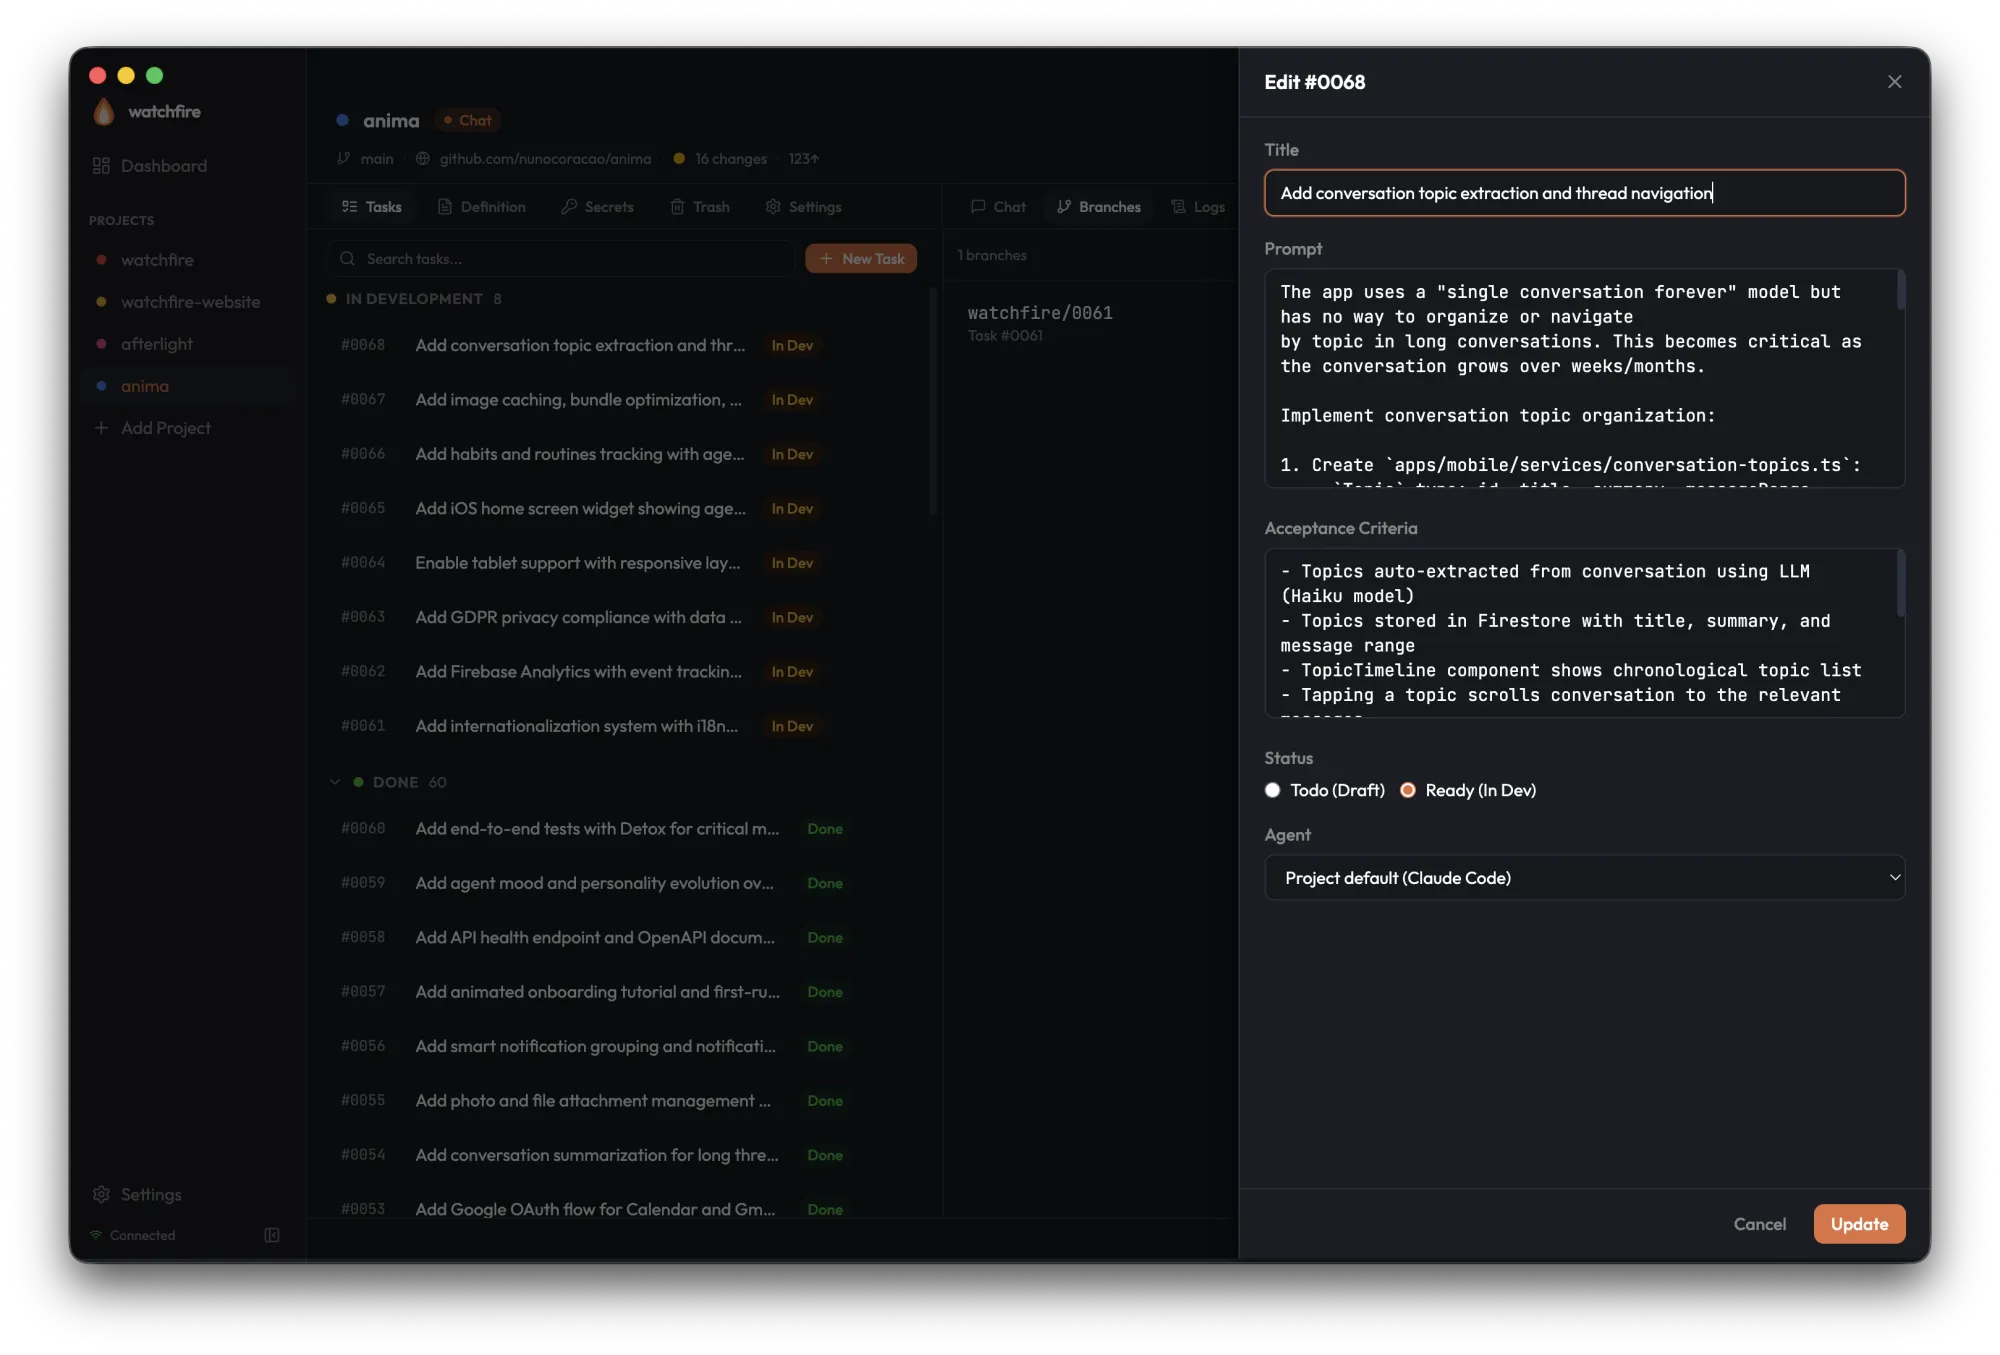
Opening a task brings up the task editor — title, prompt, acceptance criteria, status, and an agent picker with a leading Project default option. The form preserves its contents during background polling, so edits aren't lost when the task list refreshes.
Inspect
The Inspect tab renders the diff for the selected task as an inline file-by-file viewer.
- Pre-merge — diffs are computed as
<merge-base>...HEADon thewatchfire/<n>branch. - Post-merge — the diff is reconstructed by locating the merge commit via
git log --grep. - Output — a structured
FileDiffSet,cap at 10000 lines. - Cache — results are cached at
~/.watchfire/diff-cache/<project_id>/<task_number>.json.
Backed by the internal/daemon/diff package.
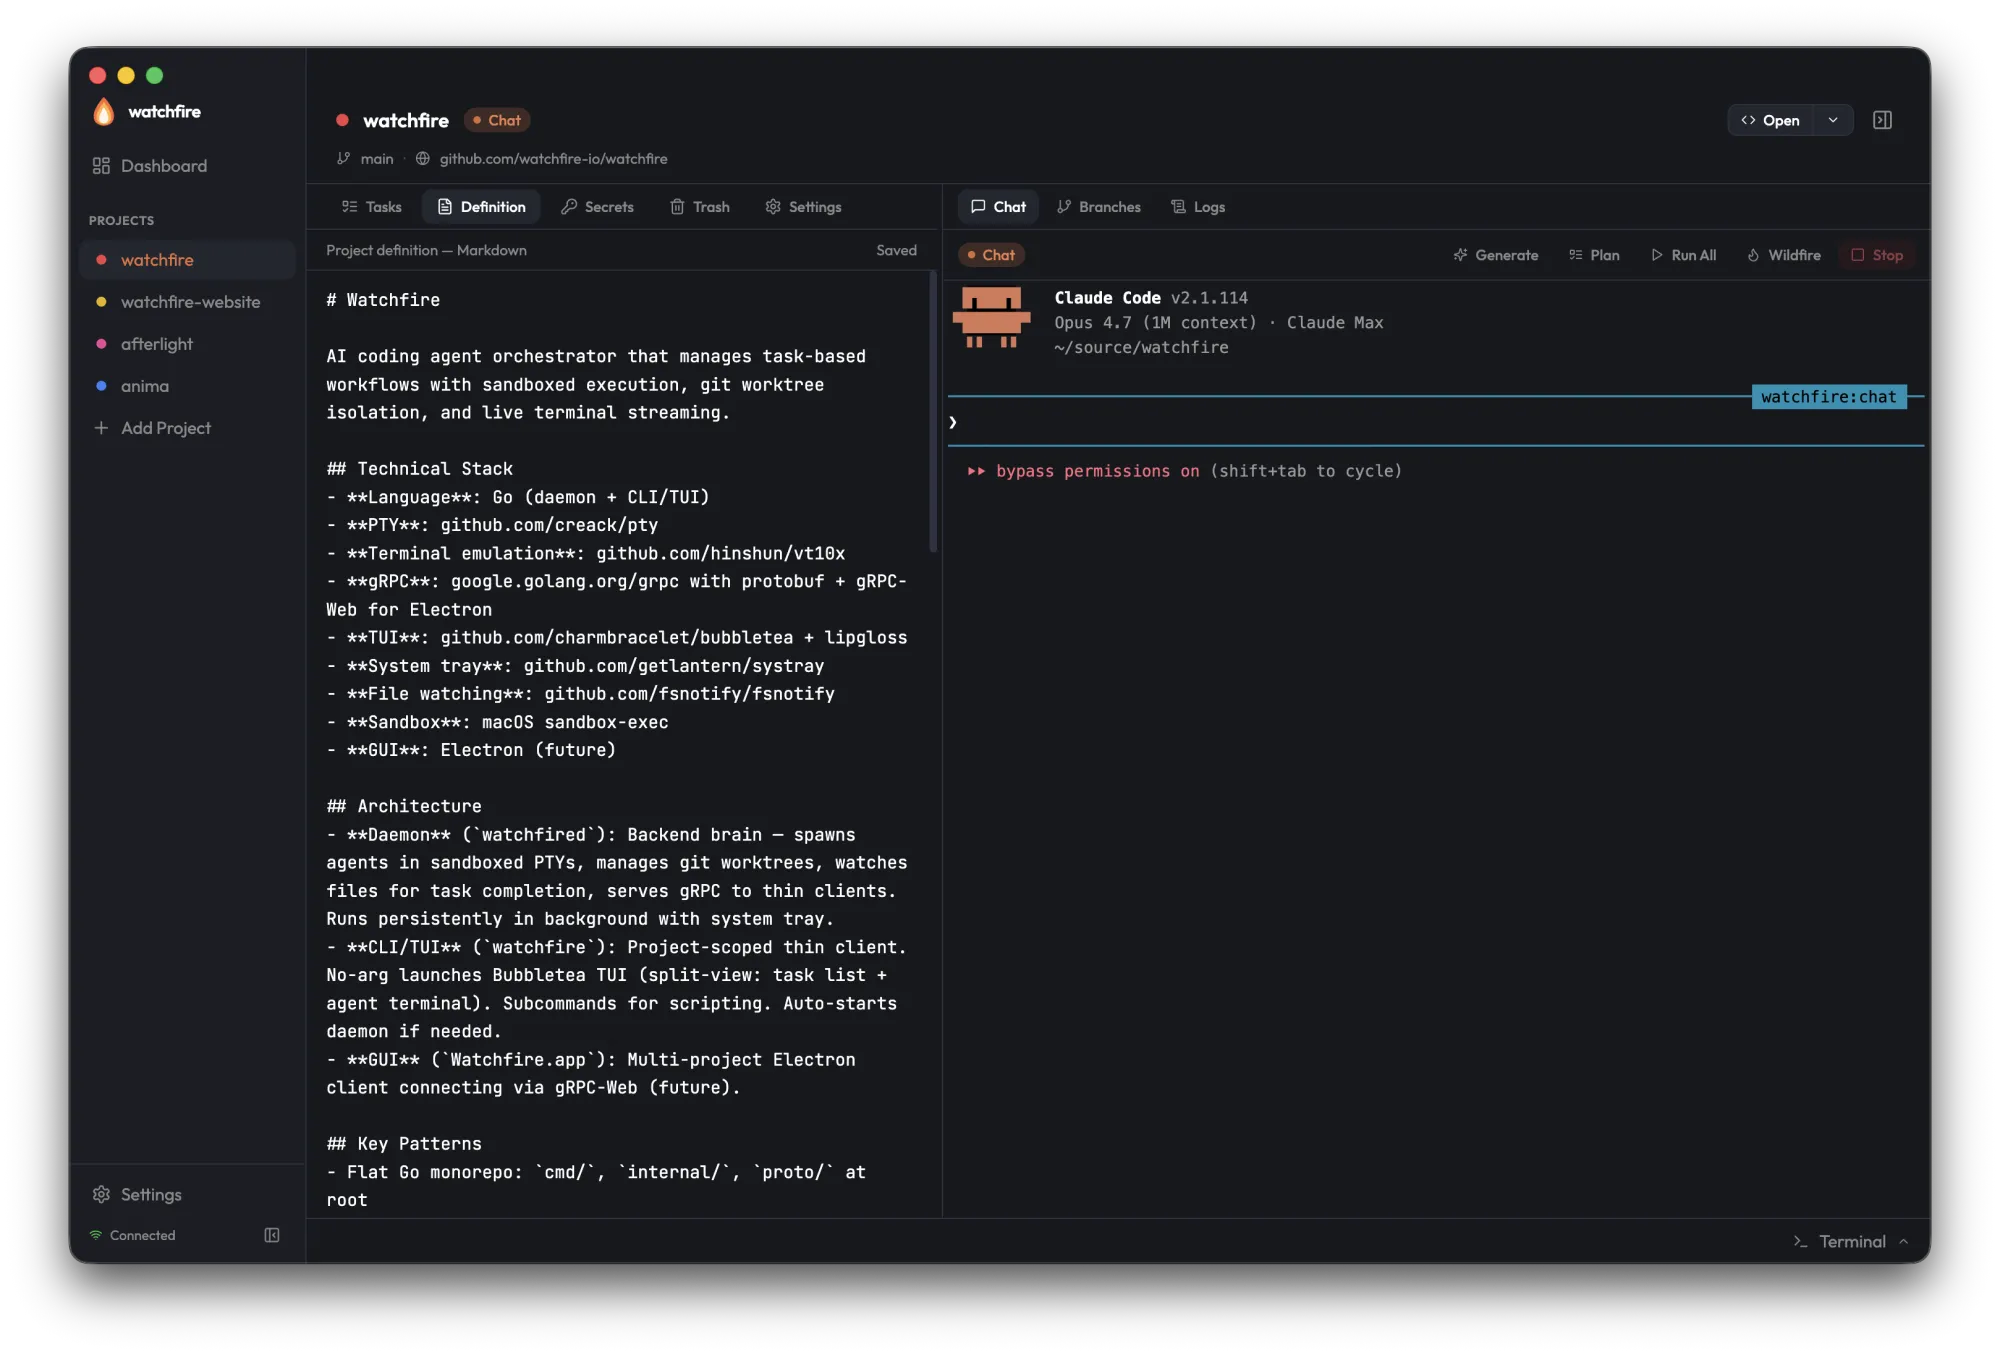
Definition
A markdown editor for the project definition — the persistent context every agent reads before starting work. Use it for architecture, key files, conventions, and constraints.
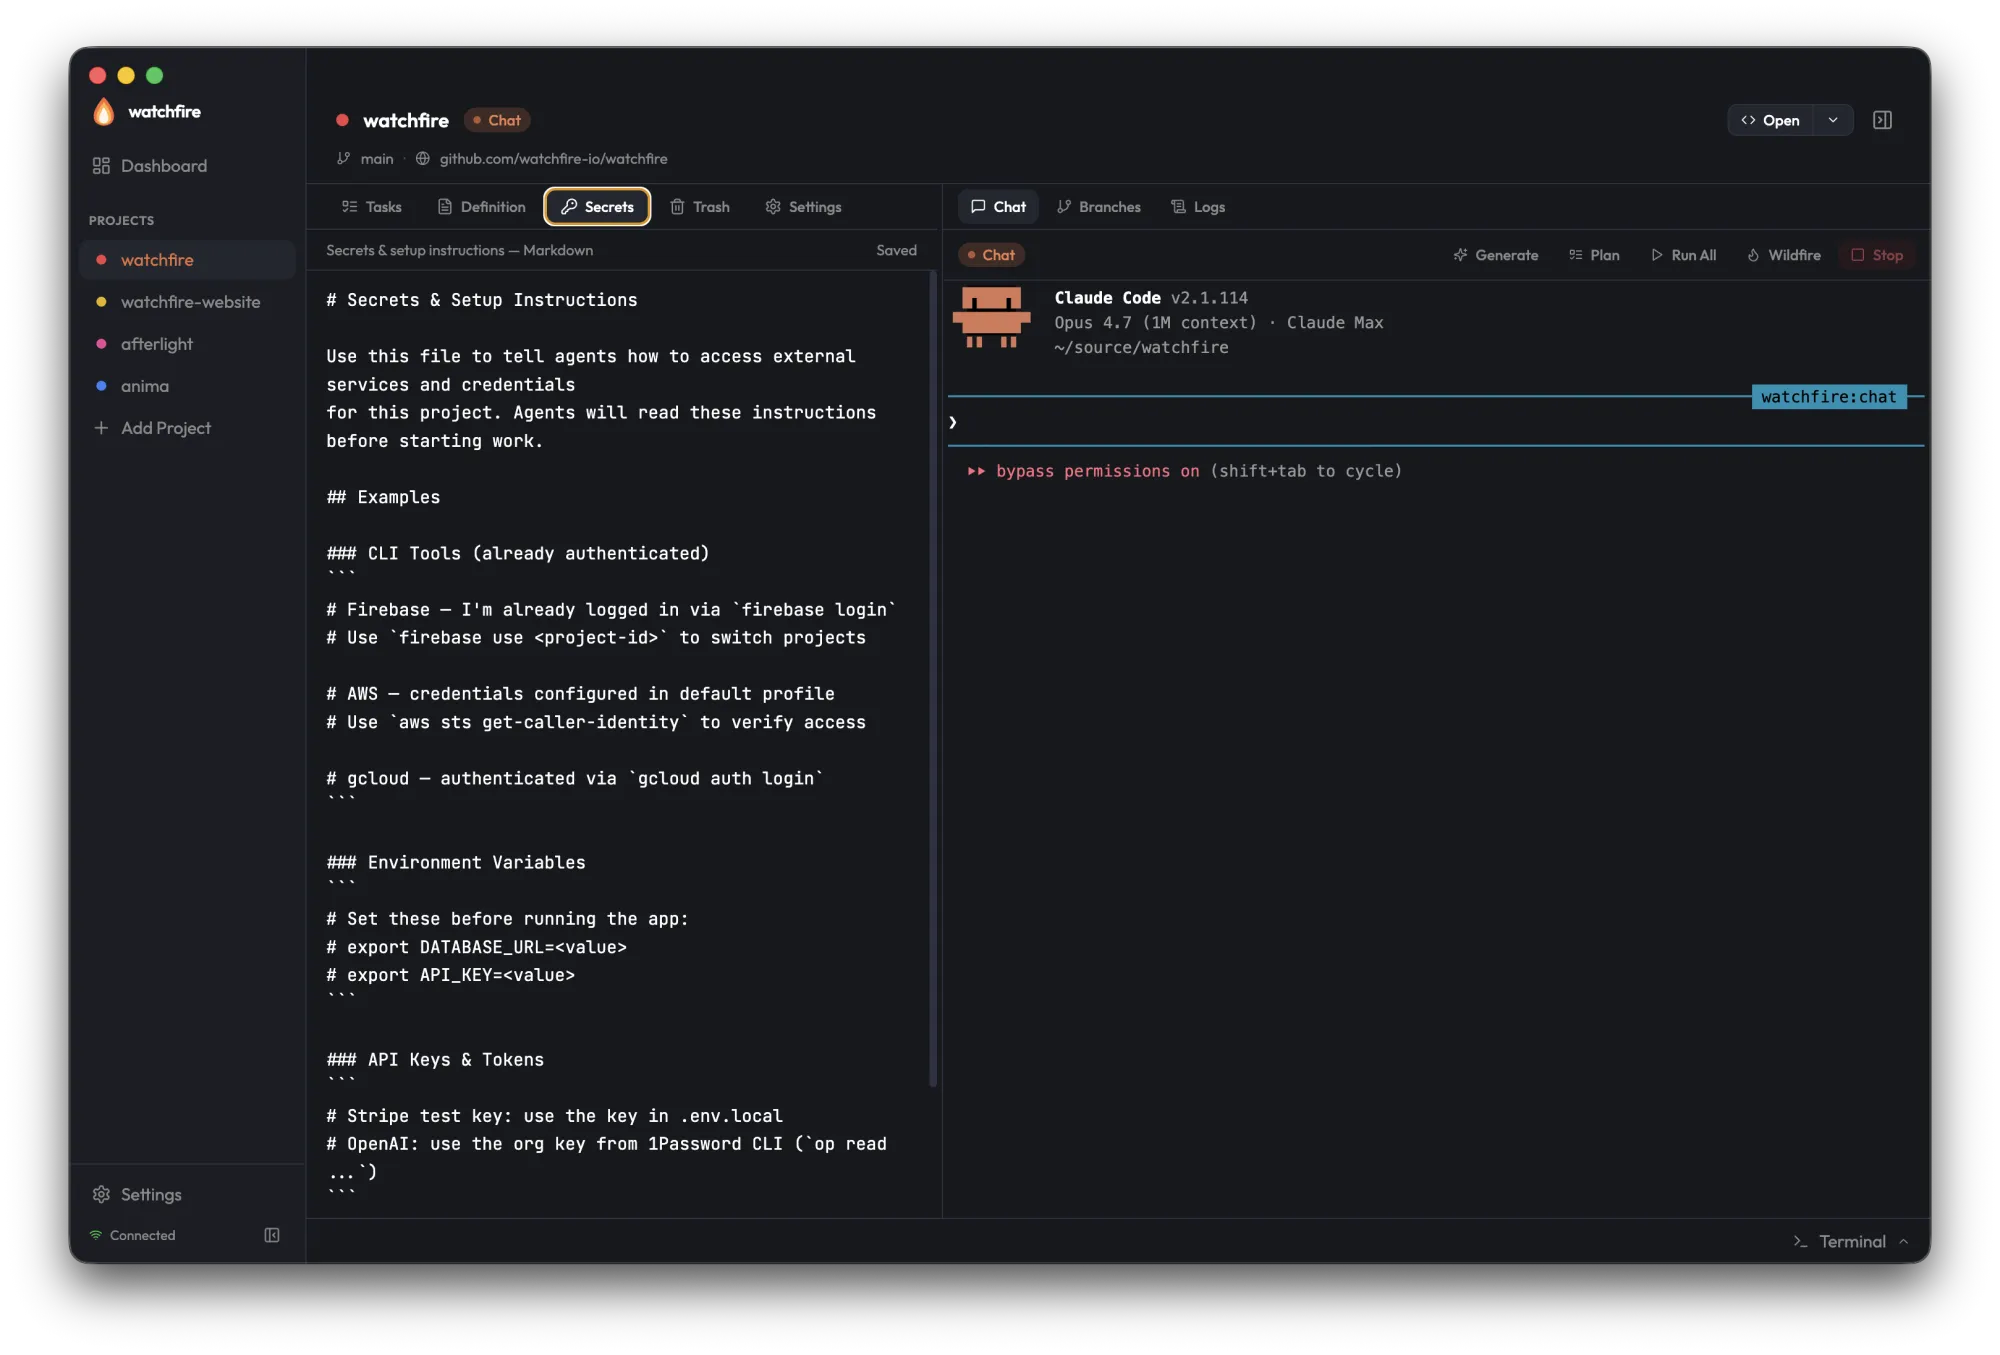
Secrets
Agent-readable instructions for accessing external services — CLI tools that need to be authenticated, environment variables, API keys, and where to find them.
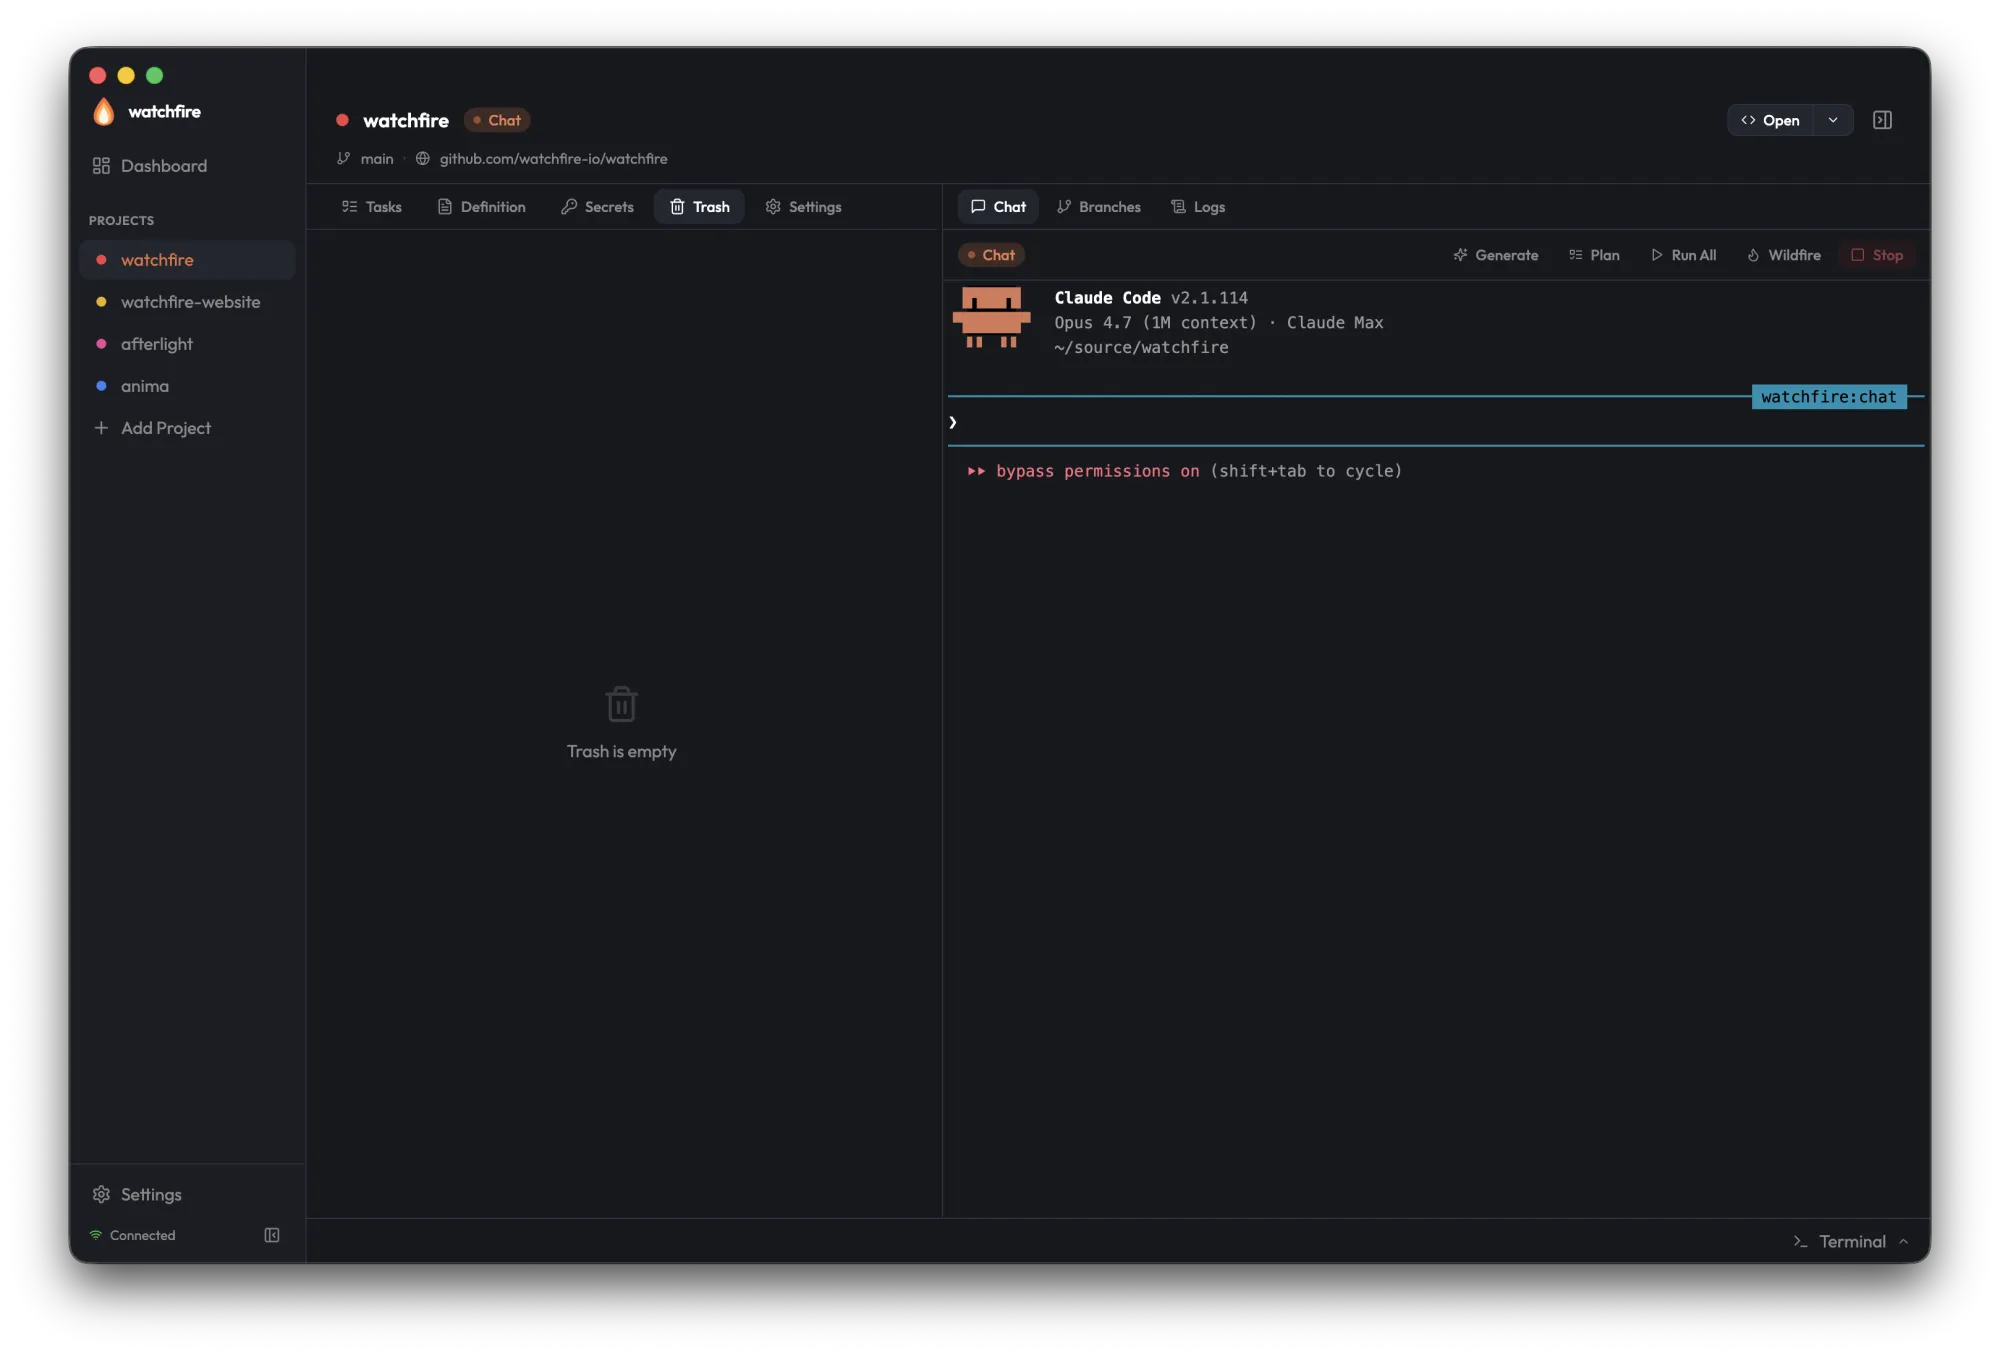
Trash
Soft-deleted tasks live here until you restore or permanently delete them.
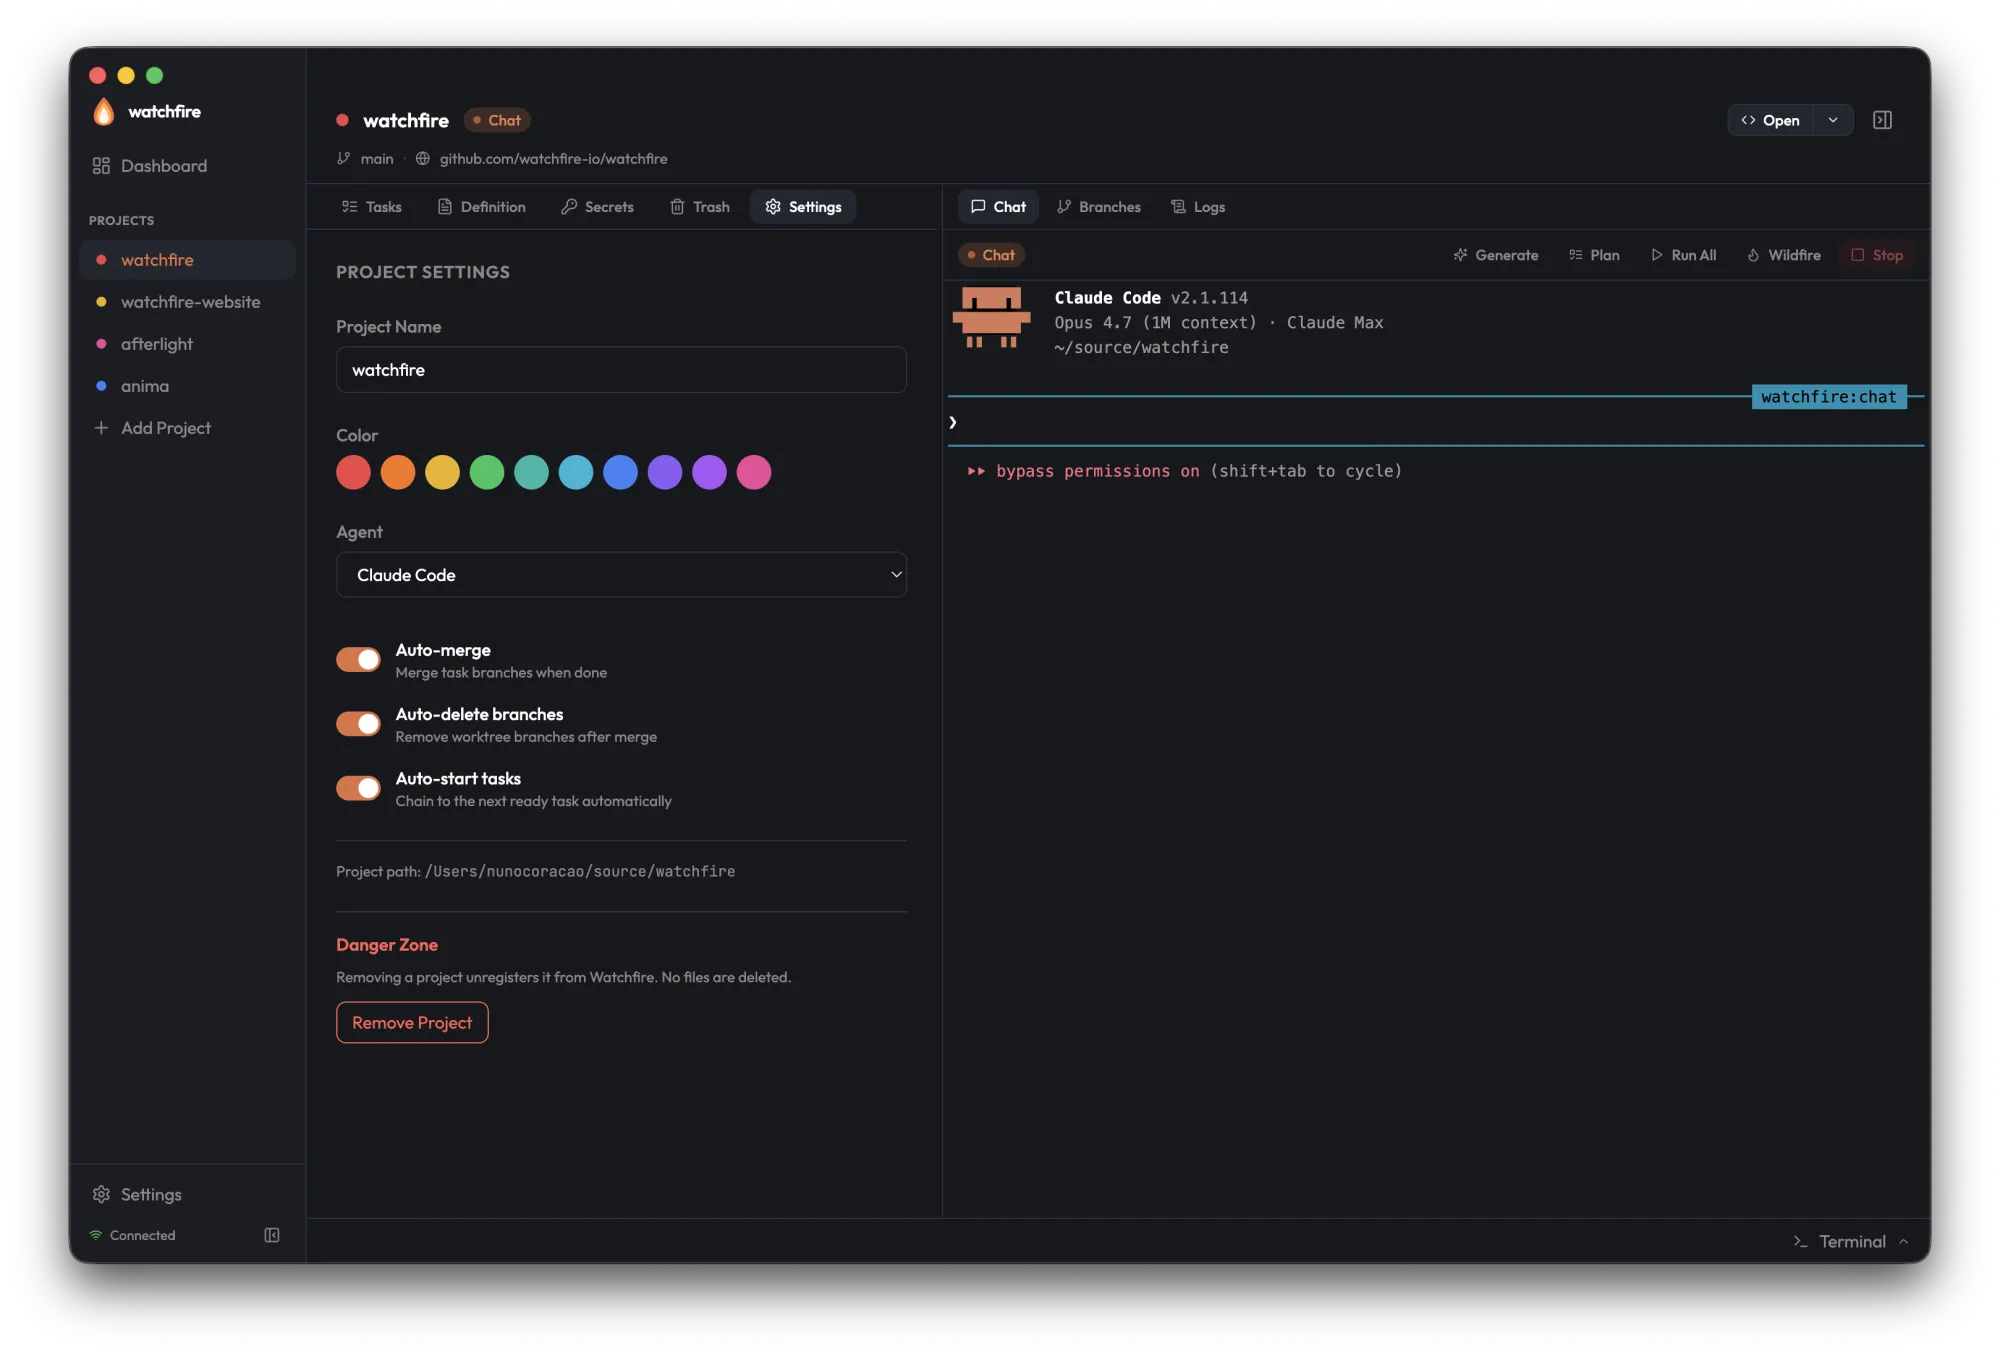
Settings
Per-project configuration — name, color (which propagates everywhere instantly), default agent, and the automation toggles for auto-merge, auto-delete branches, and auto-start tasks. The Danger Zone unregisters the project; no files are deleted.
Insights
A per-project view of agent activity, aggregated from the <n>.metrics.yaml records under .watchfire/tasks/. The tab header carries an <ExportPill> that opens the export dialog scoped to the current project (CSV or Markdown via InsightsService.ExportReport).
Layout, top to bottom:
- KPI strip — totals for tasks completed, duration, tokens, and cost in the selected window
- Stacked-bar tasks-per-day — one bar per day, stacked by exit reason
- Agent donut — share of tasks by backend
- Duration histogram — distribution of task durations
The header includes a window selector with 7d / 30d / 90d / All options. The selection persists across reloads via localStorage[wf-insights-window].
See the Insights concept page for the underlying metrics package, the per-task record schema, and how the rollup composes.
Right Panel
The right panel docks live agent output and history. Toggle it open or closed at any time.
Chat
The Chat tab streams the live agent terminal from the daemon. Watchfire clears the terminal before each new subscription, so switching projects or wildfire phase transitions never accumulate stale output. Tasks the agent creates during chat appear in real-time in the Tasks tab without a manual refresh.
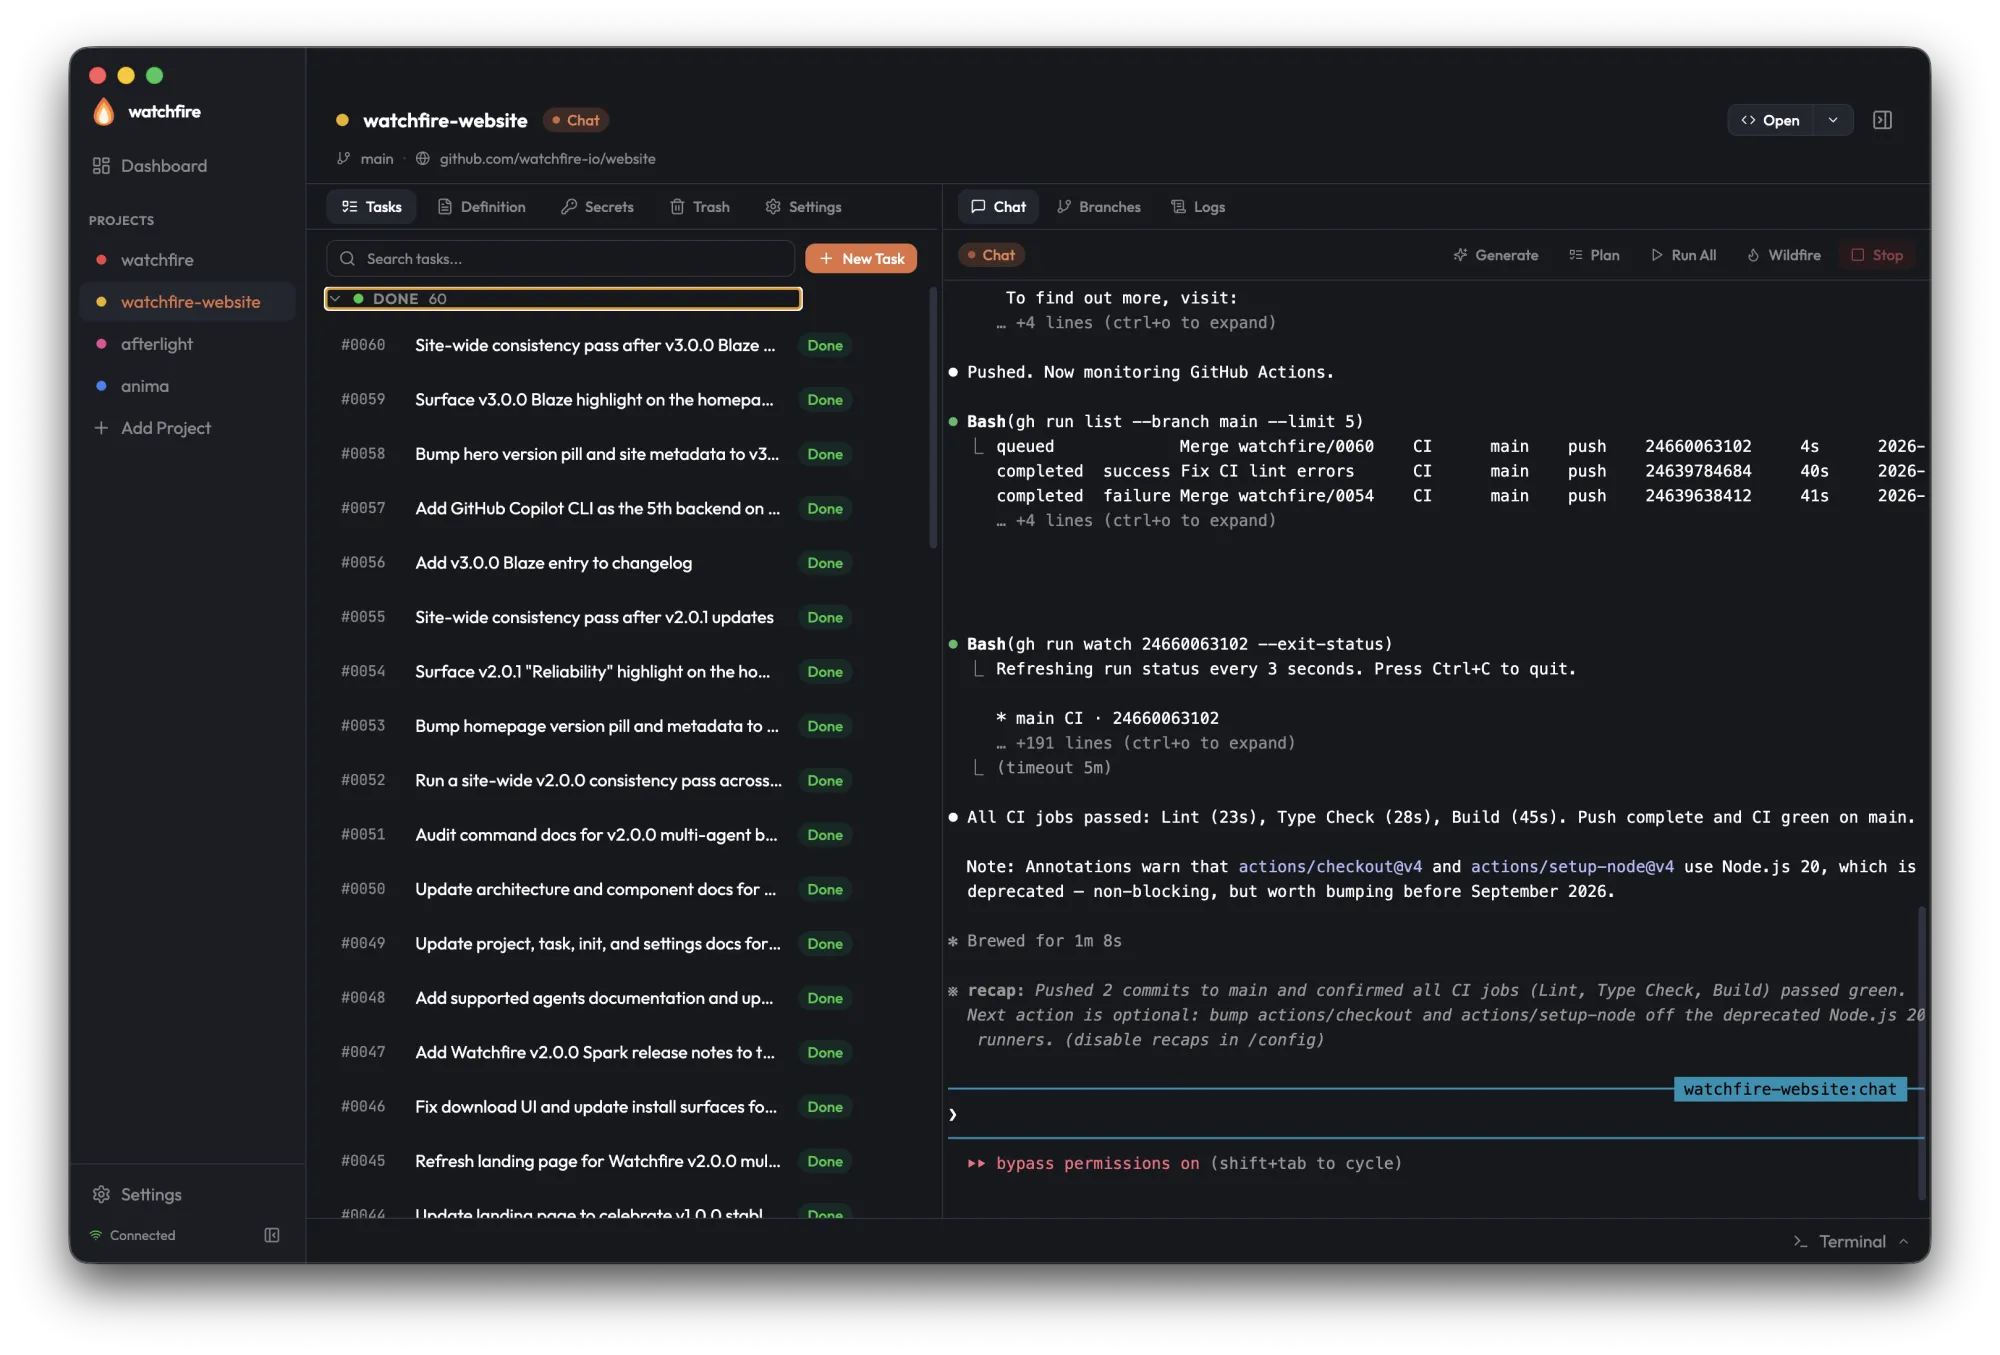
The toolbar above the terminal exposes the agent modes — Generate, Plan, Run All, Wildfire, and Stop.
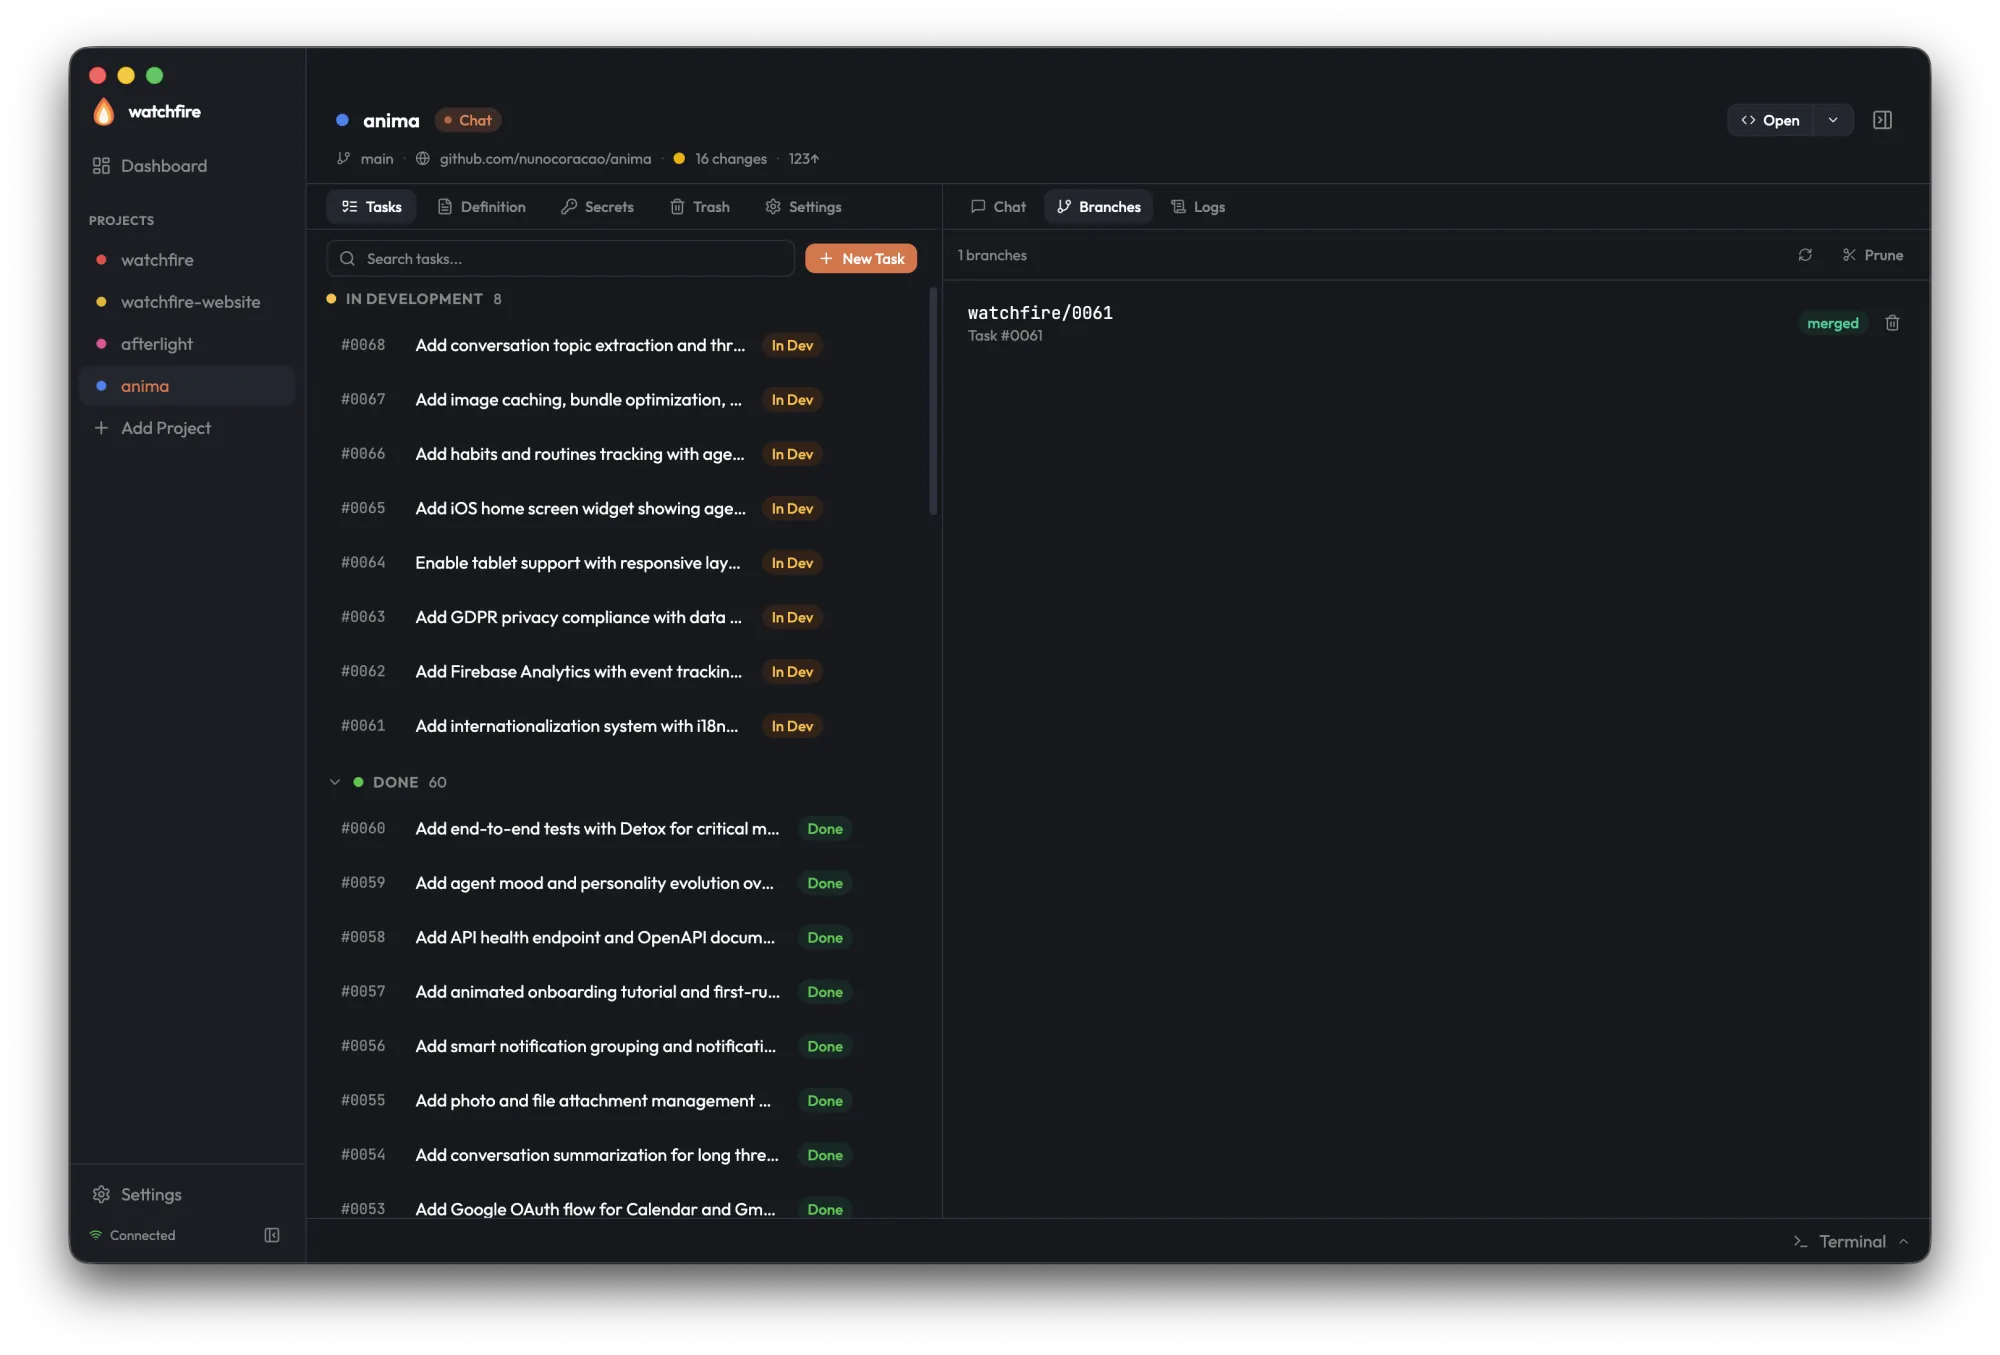
Branches
A live view of every active worktree and branch with status (in development, merged, conflict) and inline actions to merge, delete, or open in your editor.
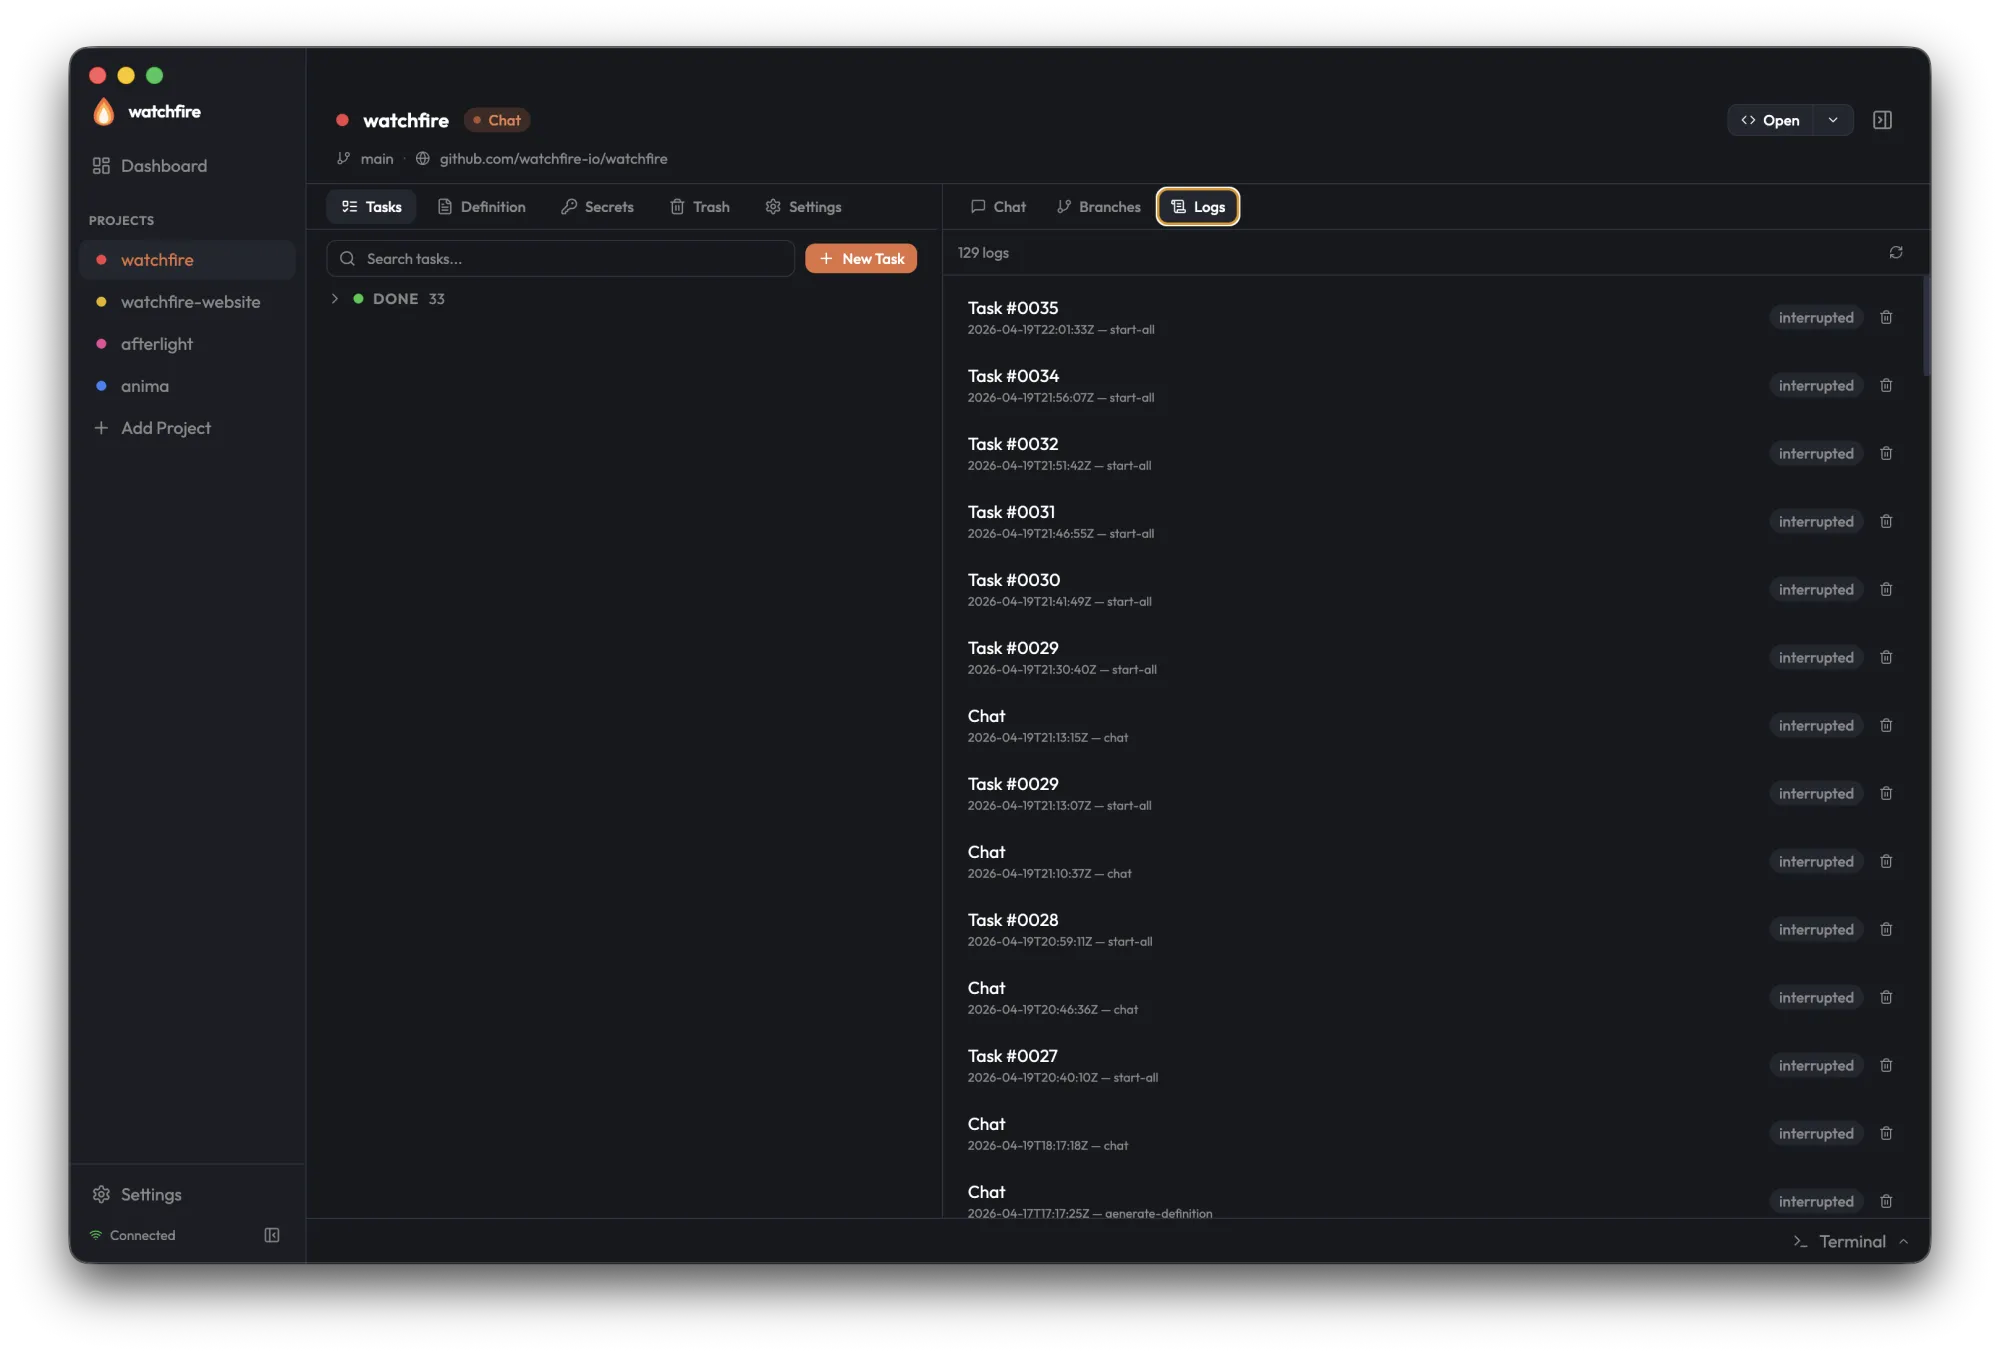
Logs
Per-task session history. The Logs tab renders formatted conversation transcripts (User/Assistant messages with tool call summaries) for every supported backend — Claude Code, Codex, opencode, Gemini, Copilot, Cursor — and falls back to raw PTY scrollback when no transcript is available.
Integrated Terminal
The GUI includes a built-in shell terminal, separate from the agent Chat terminal in the right panel. It appears as a footer bar at the bottom of the Project View.
Opening the Terminal
- Click the footer bar at the bottom of the project view, or
- Press Cmd+` (backtick) to toggle
The footer bar expands upward into a resizable bottom panel. Drag the top edge to adjust height.
Features
| Feature | Details |
|---|---|
| Tabbed sessions | Up to 5 shell tabs per project |
| Powered by node-pty | Runs in the Electron main process, not the daemon |
| Nerd Font support | Rich terminal rendering with icons and glyphs |
| Session cleanup | Sessions are cleaned up on project switch or app quit |
This is a general-purpose shell — use it for running builds, git commands, or anything else without leaving the GUI. The agent Chat terminal in the right panel streams the coding agent's output from the daemon and is a separate interface.
Task Status Display
| Internal Status | Display Label | Visual |
|---|---|---|
draft | Todo | Default style |
ready | In Development | Highlighted |
ready + agent active | In Development | Animated indicator |
done (success: true) | Done | Green indicator |
done (success: false) | Failed | Red indicator |
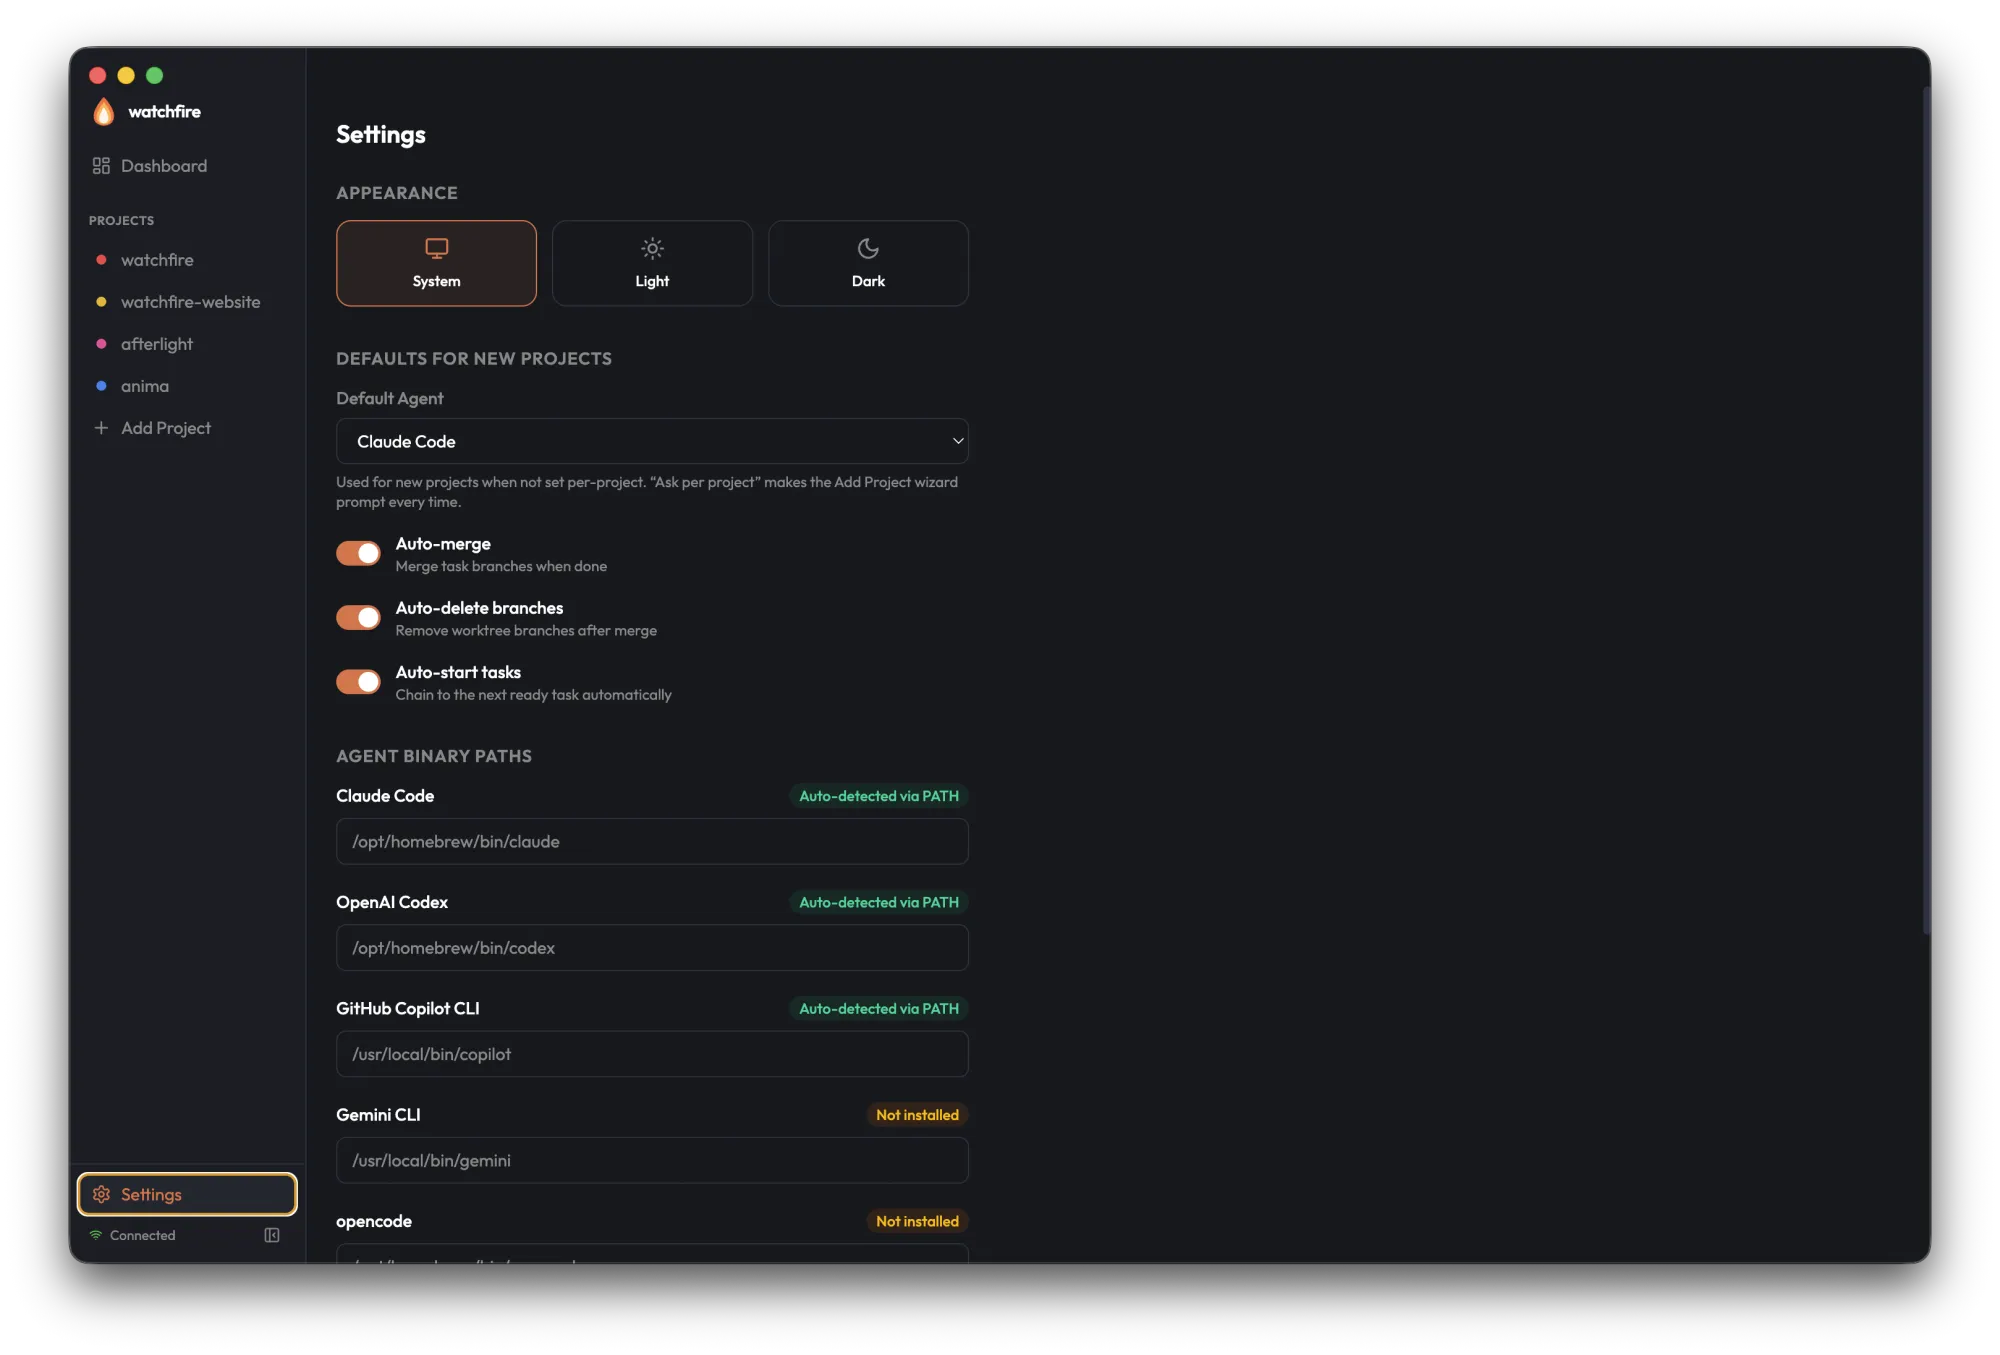
Global Settings
Open Settings from the bottom of the sidebar to manage app-wide preferences — appearance, the defaults applied to every new project, and the per-backend binary paths the daemon should use to launch agents.
The surface uses a macOS-style two-pane layout: the left sidebar lists eight categories (Appearance, Defaults, Agent Paths, Notifications, Integrations, Inbound, Updates, About), the right pane shows only the selected category. A search box at the top filters categories AND surfaces individual matching controls with category breadcrumbs — clicking a result navigates to the category and pulses the matching field for ~1.5 seconds. Cmd/Ctrl+F focuses search, Esc clears, Up/Down/Enter navigate. Existing deep-link routes (#integrations etc.) still work.
| Section | Content |
|---|---|
| Appearance | Theme (System / Light / Dark) |
| Defaults | Automation toggles for new projects, plus the default coding agent used when a project hasn't chosen one. Includes an "Ask per project" option that forces watchfire init to prompt every time. |
| Agents | Per-backend binary paths — claude, codex, opencode, gemini, copilot, cursor-agent. Leave blank to fall back to PATH and common install locations. Also shows auto-detection status and install instructions for each backend. |
| Notifications | Notification preferences — master toggle, per-event toggles (TASK_FAILED, RUN_COMPLETE, WEEKLY_DIGEST), sounds + volume, quiet hours, and a per-project mute list. See below. |
| Integrations | Outbound adapters (webhook, Slack, Discord, GitHub auto-PR) plus the Inbound subsection covering the HTTP server, per-provider secrets, and per-provider URLs. See below. |
| Updates | Check frequency, auto-download toggle |
Notification Preferences
The Notifications panel reads and writes the defaults.notifications section of ~/.watchfire/settings.yaml. Every toggle below is gated through models.ShouldNotify on the daemon, so changes take effect on the next event without a restart.
| Control | Default | Notes |
|---|---|---|
| Master toggle | On | Top-level kill switch — turning it off silences every event kind without losing per-event preferences. |
| Per-event toggles | TASK_FAILED on, RUN_COMPLETE on, WEEKLY_DIGEST off | One row per event kind. The weekly digest is the only event that defaults off — opt in to start receiving the rendered Markdown report at ~/.watchfire/digests/<YYYY-MM-DD>.md. |
| Sounds | On | Master sounds toggle. When on, the renderer plays assets/sounds/task-{done,failed}.wav while it has focus and the OS toast is sent silent — exactly one cue per event. |
| Volume slider | 100% | Linear 0–100 scale applied to renderer-side audio. Has no effect on OS toast sounds when the renderer is backgrounded (those follow OS volume). |
| Quiet hours | Off | Optional time window (start/end, local time, DST-stable). When enabled and inside the window, models.ShouldNotify returns false for everything except hard failures. |
| Per-project mute | None | Per-project chip list — projects added here are skipped by ShouldNotify regardless of other toggles. Useful for noisy long-running projects. |
Clicking any OS toast or tray Notifications submenu entry routes through DaemonService.SubscribeFocusEvents to bring this GUI to the originating project and task.
Integrations
The Integrations panel renders as gui/src/renderer/src/views/Settings/IntegrationsSection.tsx, with one detail panel per adapter and a separate Inbound subsection driven by gui/src/renderer/src/views/Settings/InboundSection.tsx.
Outbound
Per-adapter detail panels for the outbound delivery framework:
- Webhook — URL field, HMAC secret (write-only), test button
- Slack — bot token (write-only), channel selector, test button
- Discord — webhook URL (write-only), test button
- GitHub auto-PR — opt-in toggle, prerequisites checklist (
ghonPATH,gh auth status)
Behind the scenes, the GUI talks to the daemon through IntegrationsService gRPC: List / Save / Delete / Test RPCs, with Save carrying a oneof payload. Every secret field is write-only on the wire — the GUI can save and replace, but never reads existing values back.
Inbound
The Inbound subsection drives the HTTP server documented in Integrations → Inbound:
- Listening pill — polled every 5 seconds; reflects whether the server is bound and the last error if not
ListenAddr— editable bind address, defaults to127.0.0.1:8765. A Restart button next to the field re-binds the server when changed.PublicURL— used to construct the per-provider URLs the Copy as Discord URL / Copy as GitHub URL / Copy as Slack URL / Copy as Webhook URL buttons offer- Per-provider secret inputs — four write-only fields, one per upstream (Discord public key, GitHub HMAC secret, Slack signing secret, generic webhook HMAC secret). Empty disables the corresponding handler so it returns
503. - Last-delivery timestamps — one per provider, updated whenever the daemon successfully verifies an inbound request, so it's obvious at a glance which providers are actually wired through
The whole subsection mirrors the new TUI Inbound tab inside the Integrations overlay.
CLI / TUI
The Watchfire CLI provides scriptable commands while the TUI offers an interactive split-view interface for managing tasks and monitoring agents.
watchfire init
watchfire init bootstraps a Watchfire project — creates .watchfire/ with project.yaml and tasks/, then registers the directory in .gitignore.